Use the Tilde Symbol (~) in R

In the vast landscape of programming languages, each has its own set of operators that perform specific functions. In R, a language widely used for statistical computing and graphics, one such operator stands out for its versatility and utility: the tilde operator (~).
While it may appear simple at first glance, understanding the tilde operator can significantly enhance your ability to manipulate and analyze data effectively. In this article, we’ll explore the various applications of the tilde operator in R and how it can be leveraged to streamline your coding workflows.
How to Use the Tilde Operator in R
The tilde operator (~) in R is primarily used to create formulas, particularly for model formulae in statistical functions like regression analysis. At its core, the tilde operator separates the response variable from the explanatory variables in a formula.
Its syntax is straightforward:
response_variable ~ predictor_variable1 + predictor_variable2 + ...
Here’s a breakdown of what each component represents:
response_variable: This is the variable you are trying to predict or model. It is typically the dependent variable in statistical analyses.predictor_variable1 + predictor_variable2 + ...: These are the independent variables or predictors that you believe influence the response variable.
Together, the tilde operator and the variables on either side form a formula that can be passed to various modeling functions in R.
Example 1: Use the Tilde Operator in Linear Regression
The primary use of the tilde operator is in model formulae, particularly when fitting regression models. Let’s consider a simple linear regression as an example:
# Generate sample data
set.seed(123)
x <- rnorm(100)
y <- 2 * x + rnorm(100)

# Fit linear regression model
lm_model <- lm(y ~ x)

# Print model summary
summary(lm_model)
In this example, we start by generating synthetic data using the rnorm() function, creating x as a vector of random numbers and y as a linear function of x with added noise. Next, we fit a linear regression model using the lm() function, where y is the response variable and x is the predictor variable, denoted by the tilde operator (~).
The summary() function is then used to print out the results of the linear regression analysis, including coefficients, standard errors, t-values, and p-values.
Output:
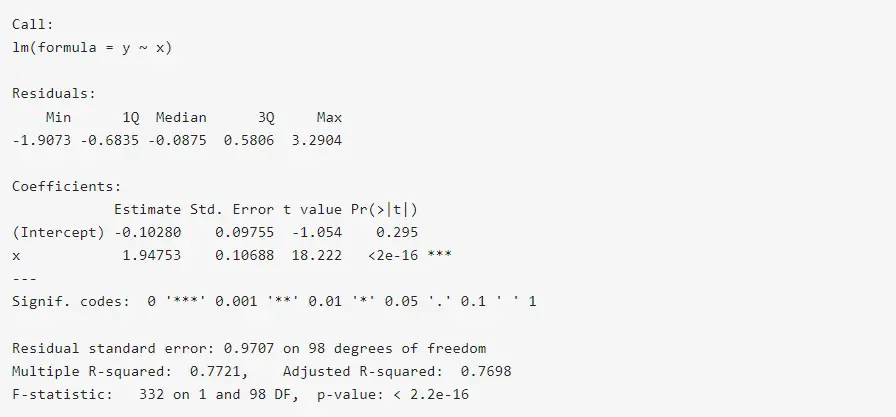
The output displays detailed information about the linear regression model, including coefficients, standard errors, p-values, and goodness-of-fit statistics.
Example 2: Use the Tilde Operator in Data Subsetting
While the tilde operator is commonly associated with modeling functions like lm(), its utility extends beyond regression analysis. It is used in various other contexts within R, such as data manipulation and plotting.
When subsetting data using the subset() function, you can use the tilde operator to specify conditions:
# Subset data based on condition
subset_data <- iris[iris$Species == "setosa", ]

# Print subsetted data
cat("Subsetted data:\n")
head(subset_data)
In this code snippet, we’re using the famous Iris dataset and filtering rows where the species is "setosa". The tilde operator (~) is not directly involved here; instead, we’re using it indirectly within the subset operation.
The resulting subset_data contains only the observations corresponding to the "setosa" species, which we then display using the head() function to show the first few rows.
Output:
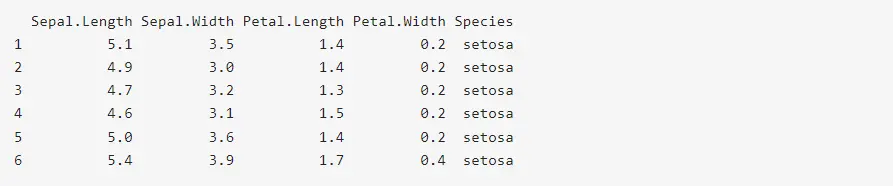
Here, the output displays the first few rows of the subsetted data, showcasing only the observations corresponding to the "setosa" species.
Example 3: Use the Tilde Operator in Plotting
In plotting functions, the tilde operator is often used to specify the relationship between variables. For instance, in the ggplot2 package:
# Plotting with ggplot2
library(ggplot2)
ggplot(data = iris, aes(x = Sepal.Length, y = Sepal.Width, color = Species)) +
    geom_point()
In this example, we’re creating a scatter plot using the ggplot2 package. We specify the dataset (iris), aesthetic mappings (aes()), and the type of plot (geom_point()) to generate.
The tilde operator (~) is utilized within the aes() function to denote the relationship between the variables Sepal.Length and Sepal.Width. Additionally, we color the points by the species of iris flowers, creating a visually appealing plot that facilitates data exploration.
Output:
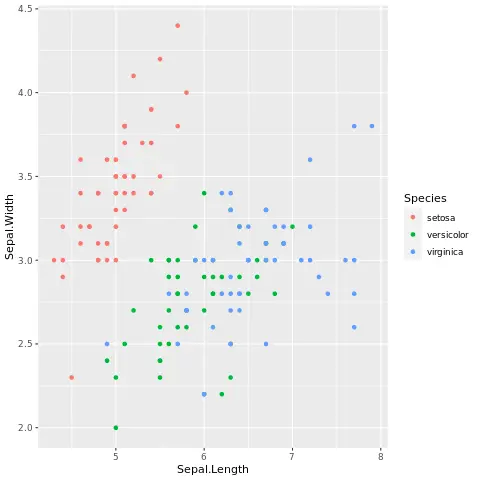
The output will display a scatter plot with sepal length on the x-axis, sepal width on the y-axis, and different colors representing different species of iris flowers.
Example 4: Use the Tilde Operator to Create Reactive Expressions in Shiny
In Shiny applications, the tilde operator can also be used to create reactive expressions for asynchronous updates. Consider the code example provided below.
In order to run this R code, you’ll need to have the Shiny package installed in R. If you haven’t already installed it, you can do so by running install.packages("shiny") in your R console.
library(shiny)

# Define Shiny UI
ui <- fluidPage(
    actionButton("button", "Click Me"),
    textOutput("text")
)

# Define Shiny server
server <- function(input, output) {
    output$text <- renderText(
        {
            input$button
            isolate(
                {
                  # Code for generating text
                  "Button Clicked!"
                }
            )
        }
    )
}

# Run Shiny app
shinyApp(ui, server)
In this Shiny example, we set up a simple Shiny application with a button and a text output.
When the button is clicked, the text output dynamically updates to display "Button Clicked!". This is achieved by using the tilde operator (~) within the renderText() function, which defines a reactive expression.
The input$button expression ensures that the text output reacts to changes in the button’s state, providing a basic example of interactivity in a Shiny app.
Output:
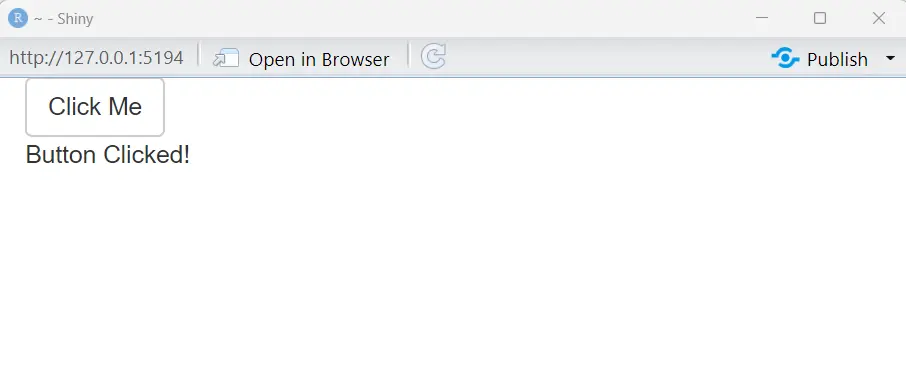
Running this Shiny app will display a button labeled "Click Me". Upon clicking the button, the text output will dynamically update to show "Button Clicked!"
Example 5: Use the Tilde Operator in Creating Formulas Dynamically
The tilde operator can be combined with paste() and as.formula() to create formulas dynamically.
# Define variables
response_var <- "y"
predictor_vars <- c("x1", "x2")

# Create a formula dynamically
formula <- as.formula(paste(response_var, "~", paste(predictor_vars, collapse = " + ")))
formula
Here, we dynamically create a formula object using variables response_var and predictor_vars.
The tilde operator (~) is utilized within the as.formula() function to specify the relationship between the response variable (y) and the predictor variables (x1 and x2). By concatenating these variables with the paste() function and separating them with +, we construct a formula object that represents a linear model with y as the response and x1 and x2 as predictors.
Finally, we display the dynamically created formula.
Output:

As we can see, the output displays the dynamically created formula, where y is the response variable and x1 and x2 are the predictor variables, separated by +.
To access detailed information about the functionality of the tilde symbol (~), execute the following code:
help("~")
This will retrieve documentation specific to the ~ symbol. This documentation can be accessed through the file browser tab within R-Studio, offering comprehensive explanations and usage guidelines for the tilde operator.
Conclusion
The tilde operator (~) in R is a powerful tool for creating formula objects, specifying relationships between variables, and enhancing code readability. Whether in defining statistical models, subsetting data frames, or creating visualizations, understanding and mastering the tilde operator is essential for proficient R programming.
By incorporating the techniques outlined in this guide, you can leverage the versatility of the tilde operator to streamline your R code and tackle complex data analysis tasks with ease.

Manav is a IT Professional who has a lot of experience as a core developer in many live projects. He is an avid learner who enjoys learning new things and sharing his findings whenever possible.
LinkedIn