Random Forest in R
A large number of decision trees are created in the Random Forest approach. This tutorial demonstrates how to apply the random forest approach in R.
Random Forest in R
A large number of decision trees are created in the Random Forest approach. Many observations are fed into the decision trees, and the most common output from those is used as the final output.
Then a new observation is sent to all decision trees to take a majority vote for every classification model. An OOB (out-of-bag) error estimate is made for the cases which were not used during the building of the tree.
Let’s use the iris data set and apply the random forest approach to it. We need to install caTools and randomForest to implement the random forest in R.
install.packages("caTools")
install.packages("randomForest")
Once the packages are installed, we can load them and start the random forest approach. See example:
# Loading package
library(caTools)
library(randomForest)

# Split the data in train data and test data with ratio 0.8
split_data <- sample.split(iris, SplitRatio = 0.8)
split_data

train_data <- subset(iris, split == "TRUE")
test_data <- subset(iris, split == "FALSE")

# Fit the random Forest to the train dataset
set.seed(120) # Setting seed
classifier_Random_Forest = randomForest(x = train_data[-4],
                             y = train_data$Species,
                             ntree = 400)

classifier_Random_Forest
The code above splits the iris data with the ratio of 0.8 and then creates the train and test data; finally, it applies the random forest approach with 400 trees. The output is:
Call:
 randomForest(x = train_data[-4], y = train_data$Species, ntree = 400)
               Type of random forest: classification
                     Number of trees: 400
No. of variables tried at each split: 2

        OOB estimate of  error rate: 0%
Confusion matrix:
           setosa versicolor virginica class.error
setosa         30          0         0           0
versicolor      0         30         0           0
virginica       0          0        30           0
Once the random forest model is fitted, we can predict the test set result, see the confusion matrix and plot the model graphs. See the code below.
# Predict the Test set result
y_pred = predict(classifier_RF, newdata = test_data[-4])
# The Confusion Matrix
conf_matrix = table(test_data[, 4], y_pred)
conf_matrix
# Plot the random forest model
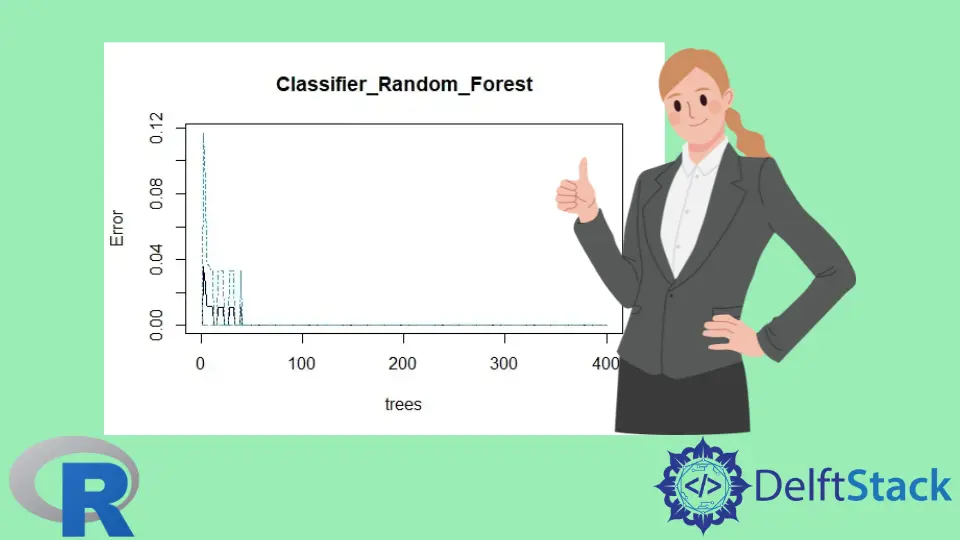
plot(classifier_Random_Forest)
# The importance plot
importance(classifier_Random_Forest)
# The Variable importance plot
varImpPlot(classifier_Random_Forest)
The code above predicts the test set result and then shows the confusion matrix. Finally, it shows the random forest model plot, the importance, and the variable importance plot.
See output:
> conf_matrix
     y_pred
      setosa versicolor virginica
  0.1      1          0         0
  0.2     10          0         0
  0.3      3          0         0
  0.4      4          0         0
  0.5      1          0         0
  0.6      1          0         0
  1        0          2         0
  1.1      0          1         0
  1.2      0          1         0
  1.3      0          5         0
  1.4      0          3         0
  1.5      0          6         1
  1.6      0          1         1
  1.7      0          1         0
  1.8      0          2         4
  1.9      0          0         3
  2        0          0         3
  2.1      0          0         1
  2.3      0          0         4
  2.4      0          0         1
The Random Forest model plot:

The Importance of the random forest model:
             MeanDecreaseGini
Sepal.Length        6.1736467
Sepal.Width         0.9664428
Petal.Length       24.1454822
Species            28.0489838
The Variable Importance plot:


Sheeraz is a Doctorate fellow in Computer Science at Northwestern Polytechnical University, Xian, China. He has 7 years of Software Development experience in AI, Web, Database, and Desktop technologies. He writes tutorials in Java, PHP, Python, GoLang, R, etc., to help beginners learn the field of Computer Science.
LinkedIn Facebook