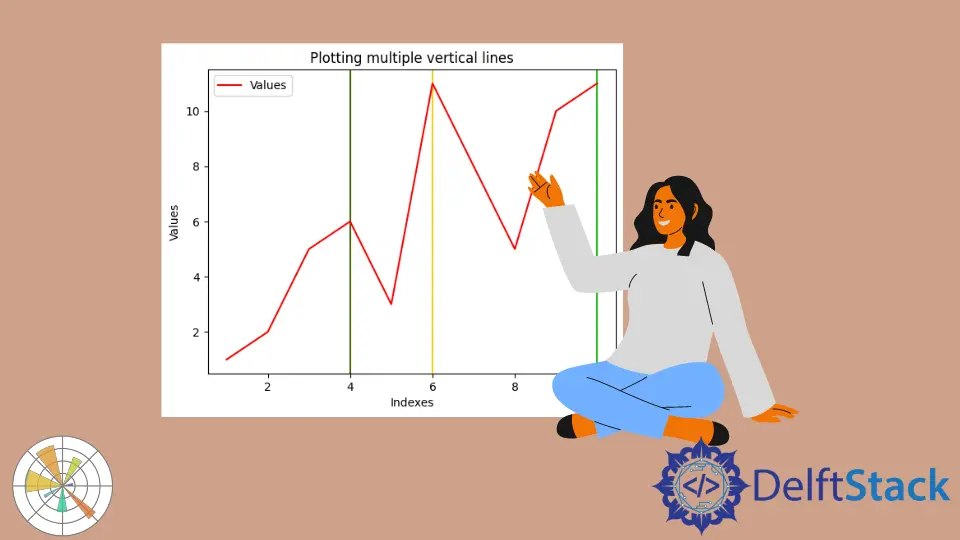
Desenhar linhas verticais em um gráfico Matplotlib
Vaibhav Vaibhav
15 fevereiro 2024
Matplotlib
Matplotlib Line

Ao trabalhar com gráficos, muitas vezes temos que desenhar linhas horizontais e verticais sobre os gráficos para representar algumas informações. Pode ser algum valor médio, algum valor limite ou algum intervalo. Este artigo falará sobre como podemos criar linhas verticais em gráficos gerados usando Matplotlib em Python.
Desenhe linhas verticais usando axvline() no Matplotlib
axvline() é uma função da biblioteca Matplotlib que desenha linhas verticais ao longo dos eixos. Esta função usa muitos argumentos, mas falaremos sobre três deles, listados a seguir.
x: The position of the line on thex-axisymin: Este valor deve estar entre 0 e 1, onde 0 representa a parte inferior do gráfico e 1 representa o topo do gráfico.ymax: Este valor deve estar entre 0 e 1, onde 0 representa a parte inferior do gráfico e 1 representa o topo do gráfico.
Outros argumentos incluem color, label, marker, snap, transform, url, visible, etc.
Consulte os exemplos a seguir para entender como usar esta função.
Exemplo 1 - Traçando uma única linha vertical
import random
import numpy as np
import matplotlib.pyplot as plt

x = np.array([1, 2, 3, 4, 5, 6, 7, 8, 9, 10])
y = np.array([1, 2, 5, 6, 3, 11, 8, 5, 10, 11])
# Plotting a single vertical line
plt.axvline(x=5, color="green", label="Index 5")
plt.plot(x, y, color="red", label="Values")
plt.title("Plotting a single vertical line")
plt.xlabel("Indexes")
plt.ylabel("Values")
plt.legend()
plt.show()
Resultado:

Exemplo 2 - Plotagem de múltiplas linhas verticais
import random
import numpy as np
import matplotlib.pyplot as plt

x = np.array([1, 2, 3, 4, 5, 6, 7, 8, 9, 10])
y = np.array([1, 2, 5, 6, 3, 11, 8, 5, 10, 11])

for i in range(3):
    plt.axvline(
        x=random.randint(1, 10),
        color=np.random.rand(
            3,
        ),
    )  # Plotting a vertical line

plt.plot(x, y, color="red", label="Values")
plt.title("Plotting multiple vertical lines")
plt.xlabel("Indexes")
plt.ylabel("Values")
plt.legend()
plt.show()
Resultado:

Exemplo 3 - Linhas múltiplas com comprimentos variáveis
import random
import numpy as np
import matplotlib.pyplot as plt

x = np.array([1, 2, 3, 4, 5, 6, 7, 8, 9, 10])
y = np.array([1, 2, 5, 6, 3, 11, 8, 5, 10, 11])
yMins = [1, 0.7, 0.5]
yMaxs = [0.1, 0.4, 0]
positions = [2, 4, 8]

for i in range(3):
    plt.axvline(
        x=positions[i],
        ymin=yMins[i],
        ymax=yMaxs[i],
        color=np.random.rand(
            3,
        ),
    )  # Plotting a vertical line

plt.plot(x, y, color="red", label="Values")
plt.title("Plotting a multiple vertical lines")
plt.xlabel("Indexes")
plt.ylabel("Values")
plt.legend()
plt.show()
Resultado:

Está gostando dos nossos tutoriais? Inscreva-se no DelftStack no YouTube para nos apoiar na criação de mais vídeos tutoriais de alta qualidade. Inscrever-se
Autor: Vaibhav Vaibhav
