R의 table() 함수

table() 메서드는 데이터를 범주적으로 표현하는 데 사용됩니다. 이 튜토리얼은 R에서 table() 메소드를 사용하는 방법을 보여줍니다.
R의 table() 함수
데이터를 범주적으로 표시하려면 table() 메서드를 사용하여 이를 달성합니다. 이 범주형 표현은 주어진 변수 이름과 빈도를 테이블 형식으로 사용하여 수행됩니다.
이 메서드의 구문은 다음과 같습니다.
table(x)
이 구문에서 x는 테이블로 변환될 개체입니다.
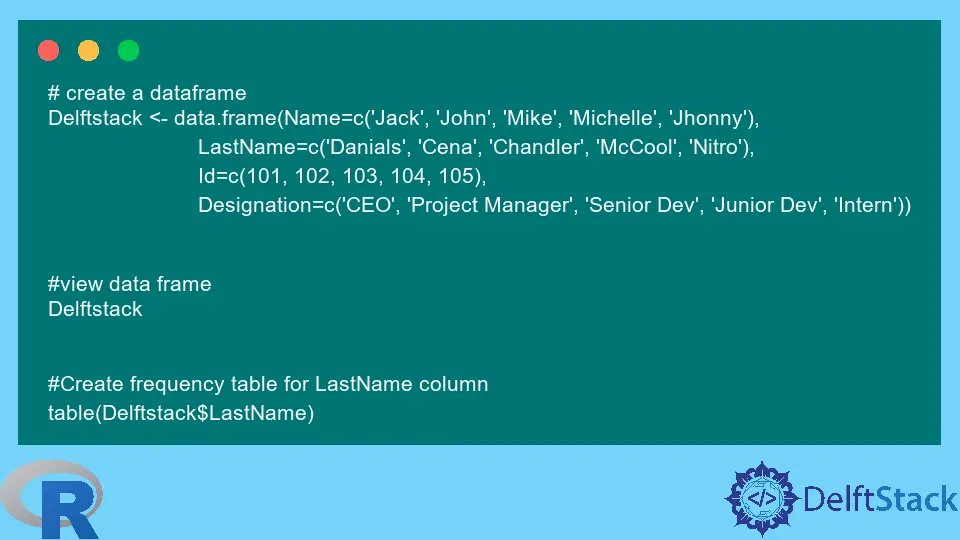
table() 메서드를 사용하여 데이터 프레임에서 빈도 테이블을 생성해 보겠습니다.
# create a dataframe
Delftstack <- data.frame(Name=c('Jack', 'John', 'Mike', 'Michelle', 'Jhonny'),
                         LastName=c('Danials', 'Cena', 'Chandler', 'McCool', 'Nitro'),
                         Id=c(101, 102, 103, 104, 105),
                         Designation=c('CEO', 'Project Manager', 'Senior Dev', 'Junior Dev', 'Intern'))


#view data frame
Delftstack


#Create frequency table for LastName column
table(Delftstack$LastName)
위의 코드는 Delftstack 데이터 프레임의 LastName 열에 대한 빈도 테이블을 생성합니다. 출력 참조:
      Name LastName  Id     Designation
1     Jack  Danials 101             CEO
2     John     Cena 102 Project Manager
3     Mike Chandler 103      Senior Dev
4 Michelle   McCool 104      Junior Dev
5   Jhonny    Nitro 105          Intern

    Cena Chandler  Danials   McCool    Nitro
       1        1        1        1        1
마찬가지로 prop.table() 및 table() 메서드를 사용하여 동일한 열에 대한 비율의 빈도 테이블을 만들 수 있습니다. 예를 들어 보겠습니다.
#calculate frequency table of proportions for LastName Column
prop.table(table(Delftstack$LastName))
위의 코드는 주어진 열 또는 변수에 대한 비율의 빈도 테이블을 생성합니다. 출력 참조:
    Cena Chandler  Danials   McCool    Nitro
     0.2      0.2      0.2      0.2      0.2
위의 데이터는 각 성이 데이터 프레임에 있는 사람의 20%에게 부여되었음을 보여줍니다. 유사하게, 우리는 두 변수에 대한 빈도표를 계산할 수 있습니다.
예를 참조하십시오.
#Create frequency table for Name and LastName column
table(Delftstack$Name, Delftstack$LastName)
위의 코드는 Name 및 LastName 열에 대한 빈도 테이블을 생성합니다. 출력 참조:
           Cena Chandler Danials McCool Nitro
  Jack        0        0       1      0     0
  Jhonny      0        0       0      0     1
  John        1        0       0      0     0
  Michelle    0        0       0      1     0
  Mike        0        1       0      0     0
위의 코드는 Name을 LastName과 일치시킵니다. 예를 들어 Jack의 경우 Danials는 빈도가 1이기 때문에 성입니다. 마찬가지로 두 변수에 대한 비율의 빈도 테이블을 만들 수 있습니다.
예를 참조하십시오.
#calculate frequency table of proportions for Name and LastName Column
prop.table(table(Delftstack$Name, Delftstack$LastName))
위의 코드는 Name과 LastName 두 열에 대한 비율의 빈도 테이블을 계산합니다. 출력 참조:
           Cena Chandler Danials McCool Nitro
  Jack      0.0      0.0     0.2    0.0   0.0
  Jhonny    0.0      0.0     0.0    0.0   0.2
  John      0.2      0.0     0.0    0.0   0.0
  Michelle  0.0      0.0     0.0    0.2   0.0
  Mike      0.0      0.2     0.0    0.0   0.0
다음은 단일 및 다중 변수 또는 열에 대한 빈도 테이블 및 비율의 빈도 테이블을 계산하기 위한 전체 코드입니다.
# create a dataframe
Delftstack <- data.frame(Name=c('Jack', 'John', 'Mike', 'Michelle', 'Jhonny'),
                         LastName=c('Danials', 'Cena', 'Chandler', 'McCool', 'Nitro'),
                         Id=c(101, 102, 103, 104, 105),
                         Designation=c('CEO', 'Project Manager', 'Senior Dev', 'Junior Dev', 'Intern'))


#view data frame
Delftstack


#Create frequency table for LastName column
table(Delftstack$LastName)

#calculate frequency table of proportions for LastName Column
prop.table(table(Delftstack$LastName))

#Create frequency table for Name and LastName column
table(Delftstack$Name, Delftstack$LastName)

#calculate frequency table of proportions for Name and LastName Column
prop.table(table(Delftstack$Name, Delftstack$LastName))
Sheeraz is a Doctorate fellow in Computer Science at Northwestern Polytechnical University, Xian, China. He has 7 years of Software Development experience in AI, Web, Database, and Desktop technologies. He writes tutorials in Java, PHP, Python, GoLang, R, etc., to help beginners learn the field of Computer Science.
LinkedIn Facebook