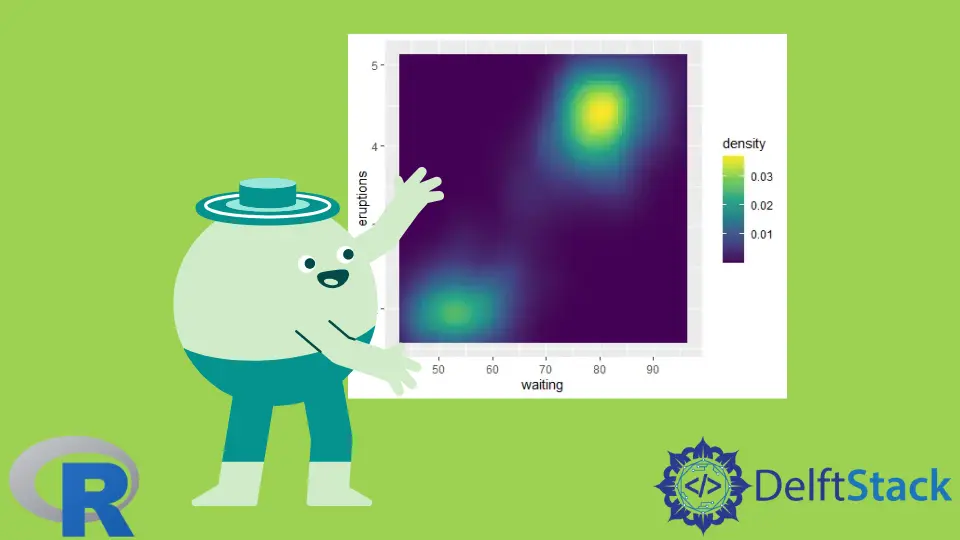
R의 scale_fill_continuous

scale_fill_continuous() 메소드는 ggplot2 패키지에서 가져왔습니다. 이 튜토리얼은 R에서 scale_fill_continuous() 메서드를 사용하는 방법과 위치를 보여줍니다.
R에서 연속 채우기
scale_fill_continuous 방법은 continuous가 fill에 매핑될 때 ggplot2 패키지의 기본 색상 스케일입니다. 이 메서드의 구문은 다음과 같습니다.
scale_fill_continuous(..., type = getOption("ggplot2.continuous.fill"))
메서드는 options()를 사용하여 기본 설정을 결정합니다. 여기서 ggplot2.continuous.fill은 continuous 색상 스케일의 기본값입니다.
scale_fill_continuous 방법에 대한 인수는 Viridis 또는 gradient일 수 있습니다. 이 방법의 예를 시도해 보겠습니다.
먼저 ggplot2 패키지를 로드하고 ggplot 그래프를 만듭니다.
library(ggplot2)
DemoGraph <- ggplot(faithfuld, aes(waiting, eruptions, fill = density)) + geom_tile()
DemoGraph

이제 scale_fill_continuous() 메서드를 사용하여 그래프에 패턴을 줄 수 있습니다. 예를 참조하십시오.
DemoGraph + scale_fill_continuous(type = "gradient")
위의 코드는 그래프에 그래디언트 패턴을 제공합니다. 출력 참조:

scale_fill_continuous 방법에서 Viridis 옵션을 사용할 수도 있습니다.
DemoGraph + scale_fill_continuous(type = "viridis")
위의 코드는 그래프의 포인트를 강조하는 Viridis 패턴을 제공합니다. 출력 참조:

다음은 편의를 위한 전체 코드입니다.
library(ggplot2)
DemoGraph <- ggplot(faithfuld, aes(waiting, eruptions, fill = density)) + geom_tile()

DemoGraph

DemoGraph + scale_fill_continuous(type = "gradient")

DemoGraph + scale_fill_continuous(type = "viridis")
Sheeraz is a Doctorate fellow in Computer Science at Northwestern Polytechnical University, Xian, China. He has 7 years of Software Development experience in AI, Web, Database, and Desktop technologies. He writes tutorials in Java, PHP, Python, GoLang, R, etc., to help beginners learn the field of Computer Science.
LinkedIn Facebook