R에서 ggplot X 축 눈금 레이블 수정
-
scale_x_discrete를 사용하여 R에서ggplotX 축 눈금 레이블 수정 -
사용자 정의 함수와 함께
scale_x_discrete를 사용하여 R에서ggplotX 축 눈금 레이블 수정

이 기사에서는 R에서ggplot x 축 눈금 레이블을 수정하는 방법을 소개합니다.
scale_x_discrete를 사용하여 R에서ggplot X 축 눈금 레이블 수정
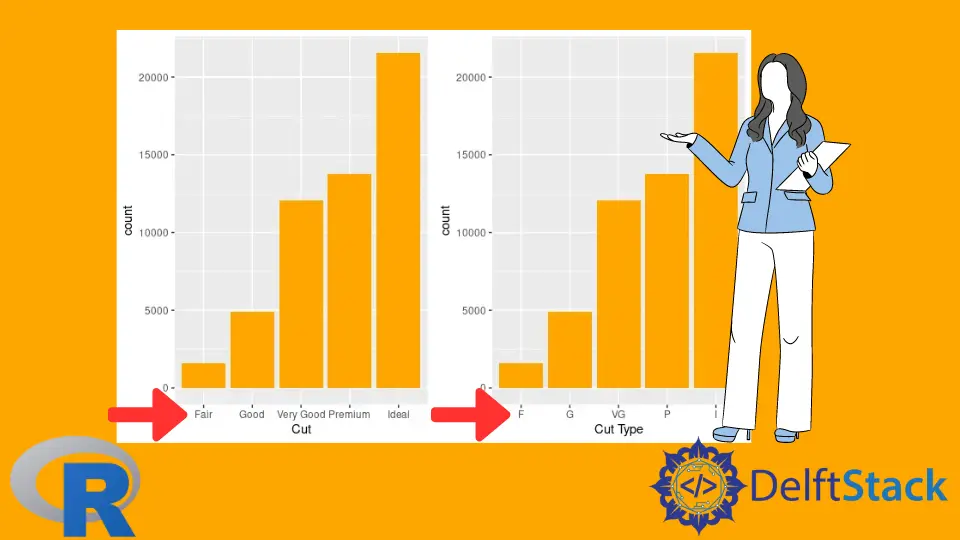
scale_x_discrete와scale_y_discrete는 플롯 스케일 레이블 및 한계의 고급 조작에 사용됩니다. 이 경우scale_x_discrete를 활용하여ggplot 객체의x 축 눈금 레이블을 수정합니다. 첫 번째ggplot 객체는diamonds 데이터 세트를 기반으로 한 막대 그래프입니다. 그래프는cut 열을 사용하고y 축에 각 유형의 개수를 표시합니다. x 축에는 기본 제목 인cut이 있으며scale_x_discrete의 첫 번째 인수로 문자열을 전달하여 수정할 수 있습니다. 또는 벡터를 생성하고labels 매개 변수에 할당하여 각 레이블에 대한 특정 문자열 값을 전달할 수 있습니다. 두 그래프는gridExtra 패키지의 일부인grid.arrange 함수를 사용하여 나란히 그려집니다.
library(ggplot2)
library(gridExtra)

p1 <- ggplot(diamonds, aes(cut)) + geom_bar(fill = "orange") + scale_x_discrete("Cut")
p2 <- p1 + scale_x_discrete("Cut Type", labels = c("Fair" = "F","Good" = "G", "Very Good" = "VG","Premium" = "P","Ideal" = "I"))

grid.arrange(p1, p2, ncol = 2)

x축의 레이블을 수정하는 또 다른 유용한 방법은 함수 객체를labels매개 변수로 전달하는 것입니다. 다음 코드 스 니펫은abbreviate함수를 사용하여 레이블을 자동으로 줄인 다음 두 개의 열로 그래프를 그립니다.
library(ggplot2)
library(gridExtra)

p1 <- ggplot(diamonds, aes(cut)) + geom_bar(fill = "orange") + scale_x_discrete("Cut")
p2 <- p1 + scale_x_discrete("Cut Type", labels = c("Fair" = "F","Good" = "G", "Very Good" = "VG","Premium" = "P","Ideal" = "I"))
p3 <- p1 + scale_x_discrete("Cut Type", labels = abbreviate)

grid.arrange(p2, p3, ncol = 2)

scale_x_discrete는 다른 그래프에서 유사하게 작동하며 다음 예제와 같이 레이블 조작 기법을 적용 할 수 있습니다. 즉, mpg데이터 세트에서 여러 산점도가 그려집니다.
library(ggplot2)
library(gridExtra)

p1 <- ggplot(mpg, aes(manufacturer, cty)) + geom_point()

p2 <- ggplot(mpg, aes(manufacturer, cty)) + geom_point() +
  scale_x_discrete(labels = abbreviate)

p3 <- ggplot(mpg, aes(manufacturer, cty)) + geom_point(colour = "blue") +
  scale_x_discrete(labels = abbreviate)

grid.arrange(p1, p2, p3, nrow = 3)

사용자 정의 함수와 함께scale_x_discrete를 사용하여 R에서ggplot X 축 눈금 레이블 수정
scale_x_discrete 매개 변수labels는 사용자 정의 함수 객체를 사용하여 각 눈금 레이블을 적절히 수정할 수 있습니다. 이 경우 먼저 각 레이블을 축약 한 다음 문자열의 시작 문자를 대문자로 변환하는capitalize_all 함수를 구현했습니다. paste,toupper,substring 및abbreviate 내장 함수는capitalize_all 기능을 구현하는 데 사용되지만 이러한 메서드에 대한 전체 검토는이 기사의 범위를 벗어납니다. R 콘솔에서?function_name 표기법을 사용하여 매뉴얼 페이지를 표시 할 수 있습니다.
library(ggplot2)
library(gridExtra)

capitalize_all <- Vectorize(function(x) {
  s <- abbreviate(x)
  paste(toupper(substring(s, 1,1)), substring(s, 2), sep="", collapse=" ")
})

ggplot(mpg, aes(manufacturer, cty)) + geom_point(aes(colour = trans)) +
  scale_x_discrete(labels = capitalize_all)

Founder of DelftStack.com. Jinku has worked in the robotics and automotive industries for over 8 years. He sharpened his coding skills when he needed to do the automatic testing, data collection from remote servers and report creation from the endurance test. He is from an electrical/electronics engineering background but has expanded his interest to embedded electronics, embedded programming and front-/back-end programming.
LinkedIn Facebook