Pandas는 테이블 스타일로 DataFrame을 표시합니다
-
IPython.display모듈의display()함수를 사용하여 테이블에 PandasDataFrame표시 -
tabulate라이브러리를 사용하여 테이블 스타일에 PandasDataFrame표시 -
dataFrame.style을 사용하여 테이블에 PandasDataFrame표시 -
Pandas
DataFrame용 스타일링 테이블

Pandas는 매우 인기 있고 유용한 데이터 과학 라이브러리입니다. 오늘날 데이터 과학에 관련된 모든 사람은 Pandas도 광범위하게 사용합니다. Excel 도구에서 보는 형식과 매우 유사한 표 형식으로 데이터를 표시합니다. Excel 도구를 사용하여 다른 사용자에게 더 매력적이고 읽기 쉬운 다양한 색상과 스타일을 추가하여 작업 또는 데이터 시트를 사용자 정의할 수 있습니다. 다양한 테이블 스타일을 통해 팬더 DataFrame을 표시하면 데이터 시각화가 향상됩니다.
tabulate 라이브러리, dataframe.style, IPython.display 모듈과 같은 다양한 테이블 스타일을 사용하여 Pandas DataFrame을 테이블 형식으로 표시하는 방법을 소개합니다.
IPython.display 모듈의 display() 함수를 사용하여 테이블에 Pandas DataFrame 표시
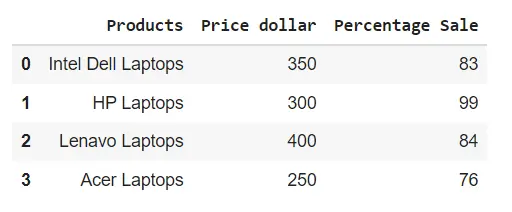
pandas DataFrame을 테이블 스타일로 표시하는 가장 간단하고 쉬운 방법은 IPython.display 모듈에서 가져오는 display() 함수를 사용하는 것입니다. 이 기능은 DataFrame을 대화식의 올바른 형식의 표 형식으로 표시합니다.
display() 함수를 잘 이해하려면 다음 예를 참조하십시오.
예제 코드:
from IPython.display import display
import pandas as pd

# creating a DataFrame
dict = {
    "Products": ["Intel Dell Laptops", "HP Laptops", "Lenavo Laptops", "Acer Laptops"],
    "Price dollar": [350, 300, 400, 250],
    "Percentage Sale": [83, 99, 84, 76],
}
dataframe = pd.DataFrame(dict)

# displaying the DataFrame
display(dataframe)
출력:
tabulate 라이브러리를 사용하여 테이블 스타일에 Pandas DataFrame 표시
위의 방법을 사용하여 pandas dataframes를 조직화된 테이블 스타일 형식으로 표시할 수 있습니다. 우리는 tabulate라는 라이브러리를 사용할 것입니다. 이 라이브러리는 팬더 dataframes를 표시할 수 있는 다양한 스타일로 구성되어 있습니다.
다음 예에서 pretty 스타일을 사용하여 팬더 DataFrame을 표시합니다.
예제 코드:
import pandas as pd
from tabulate import tabulate

# creating a DataFrame
dict = {
    "Students": ["Intel Dell Laptops", "HP Laptops", "Lenavo Laptops", "Acer Laptops"],
    "Price dollar": [350, 300, 400, 250],
    "Percentage Sale": [83, 99, 84, 76],
}
dataframe = pd.DataFrame(dict)

# displaying the DataFrame
print(tabulate(dataframe, headers="keys", tablefmt="pretty"))
출력:
+---+--------------------+--------------+-----------------+
|   |      Students      | Price dollar | Percentage Sale |
+---+--------------------+--------------+-----------------+
| 0 | Intel Dell Laptops |     350      |       83        |
| 1 |     HP Laptops     |     300      |       99        |
| 2 |   Lenavo Laptops   |     400      |       84        |
| 3 |    Acer Laptops    |     250      |       76        |
+---+--------------------+--------------+-----------------+
tabulate 라이브러리에는 팬더 DataFrame의 스타일링에 사용할 수 있는 다음 styles가 포함되어 있습니다.
plainsimplegithubgridfancy_gridpipeorgtbljiraprestoprettypsqlrstmediawikimoinmoinyoutrackhtmllatexlatex_rawlatex_booktabstextile
dataFrame.style을 사용하여 테이블에 Pandas DataFrame 표시
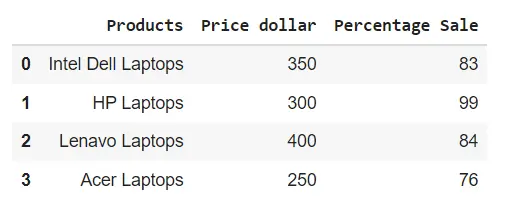
Pandas Style API를 사용하여 pandas DataFrame을 테이블 스타일로 표시할 수 있습니다. 다음 코드에서 dataframe.style을 사용합니다. dataframe.style을 사용하면 팬더 dataframes를 표시하기 위한 다양한 형식 지정 방법이 포함된 Styler 개체가 반환됩니다.
예제 코드:
import pandas as pd

# creating a DataFrame
dict = {
    "Students": ["Intel Dell Laptops", "HP Laptops", "Lenavo Laptops", "Acer Laptops"],
    "Price dollar": [350, 300, 400, 250],
    "Percentage Sale": [83, 99, 84, 76],
}
dataframe = pd.DataFrame(dict)

# displaying the DataFrame
dataframe.style
출력:
Pandas DataFrame용 스타일링 테이블
pandas DataFrame 테이블의 스타일을 향상시키기 위해 styler 개체와 연결하여 다양한 내장 함수를 사용할 수 있습니다.
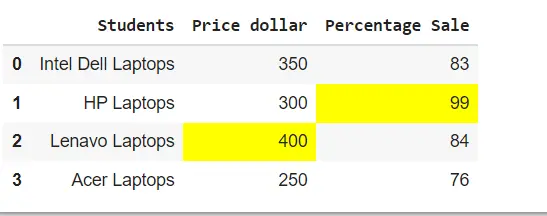
최대 값 강조 표시
스타일러 객체와 연결하여 highliglight_max() 함수를 사용한 다음 예제를 참조하십시오.
예제 코드:
import pandas as pd

# creating a DataFrame
dict = {
    "Students": ["Intel Dell Laptops", "HP Laptops", "Lenavo Laptops", "Acer Laptops"],
    "Price dollar": [350, 300, 400, 250],
    "Percentage Sale": [83, 99, 84, 76],
}
dataframe = pd.DataFrame(dict)

# displaying the DataFrame
dataframe.style.highlight_max()
출력:
background_gradient() 함수를 사용하여 heatmaps 생성
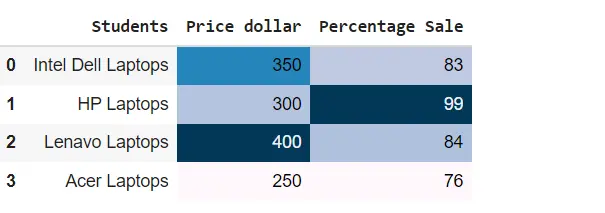
다음 예제에서는 스타일러 개체와 연결하여 팬더 DataFrame 테이블 내에 히트맵을 생성하여 background_gradient() 함수를 사용했습니다.
예제 코드:
import pandas as pd

# creating a DataFrame
dict = {
    "Students": ["Intel Dell Laptops", "HP Laptops", "Lenavo Laptops", "Acer Laptops"],
    "Price dollar": [350, 300, 400, 250],
    "Percentage Sale": [83, 99, 84, 76],
}
dataframe = pd.DataFrame(dict)

# displaying the DataFrame
dataframe.style.background_gradient()
출력:
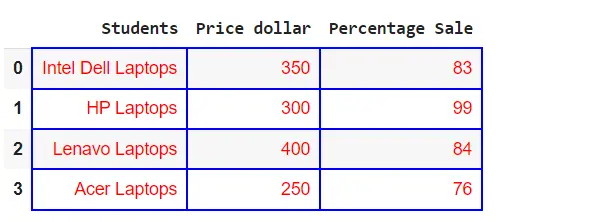
Pandas DataFrame에서 테이블 속성 설정
다음과 같이 set_properties() 함수를 사용하여 Pandas DataFrame 테이블 장식을 늘릴 수 있습니다.
예제 코드:
import pandas as pd

# creating a DataFrame
dict = {
    "Students": ["Intel Dell Laptops", "HP Laptops", "Lenavo Laptops", "Acer Laptops"],
    "Price dollar": [350, 300, 400, 250],
    "Percentage Sale": [83, 99, 84, 76],
}
dataframe = pd.DataFrame(dict)

# displaying the DataFrame
dataframe.style.set_properties(**{"border": "1.5px solid blue", "color": "red"})
출력:
사용자 정의 기능 생성
다음과 같이 styler 개체와 함께 사용자 정의 기능을 사용할 수도 있습니다.
예제 코드:
import pandas as pd
import numpy as np


def table_color(val):
    """
    Takes a scalar and returns a string with
    the css property `'color: red'` for less than 60 marks, green otherwise.
    """
    color = "green" if val > 60 else "red"
    return "color: % s" % color


# creating a DataFrame
dict = {
    "Computer Science": [77, 91, 47, 95],
    "Statistics": [83, 99, 74, 66],
    "English": [71, 67, 40, 55],
}

dataframe = pd.DataFrame(dict)

# displaying the DataFrame
dataframe.style.applymap(table_color)
출력:
