Matplotlib의 플롯 포인트
Suraj Joshi
2024년2월15일
Matplotlib
Matplotlib Scatter Plot

이 튜토리얼에서는matplotlib.pyplot.scatter()메서드와matplotlib.pyplot.plot()메서드를 사용하여 Matplotlib에서 데이터를 점으로 그리는 방법을 설명합니다.
matplotlib.pyplot.scatter()메서드를 사용하여 데이터를 점으로 플로팅
matplotlib.pyplot.scatter()는 Matplotlib에서 데이터를 점으로 표시하는 가장 간단하고 표준적인 방법입니다. 플로팅 할 데이터 좌표를 메서드에 인수로 전달합니다.
import matplotlib.pyplot as plt

x = [1, 2, 3, 4, 5, 6]
y = [2, 1, 5, 6, 3, 9]

plt.scatter(x, y)
plt.xlabel("X")
plt.ylabel("Y")
plt.title("Scatter Plot")
plt.show()
출력:

주어진 데이터 포인트에서 간단한 산점도를 생성합니다. X 및 Y 좌표를scatter()메서드에 인수로 전달하여 산점도를 생성합니다. xlabel()및ylabel()메서드는 각각 X 축 및 Y 축 레이블을 설정합니다. title()메소드는 Figure의 제목을 설정합니다.
color 및marker 매개 변수를scatter()메서드로 변경하여 산점도를 사용자 정의 할 수도 있습니다.
import matplotlib.pyplot as plt

x = [1, 2, 3, 4, 5, 6]
y = [2, 1, 5, 6, 3, 9]

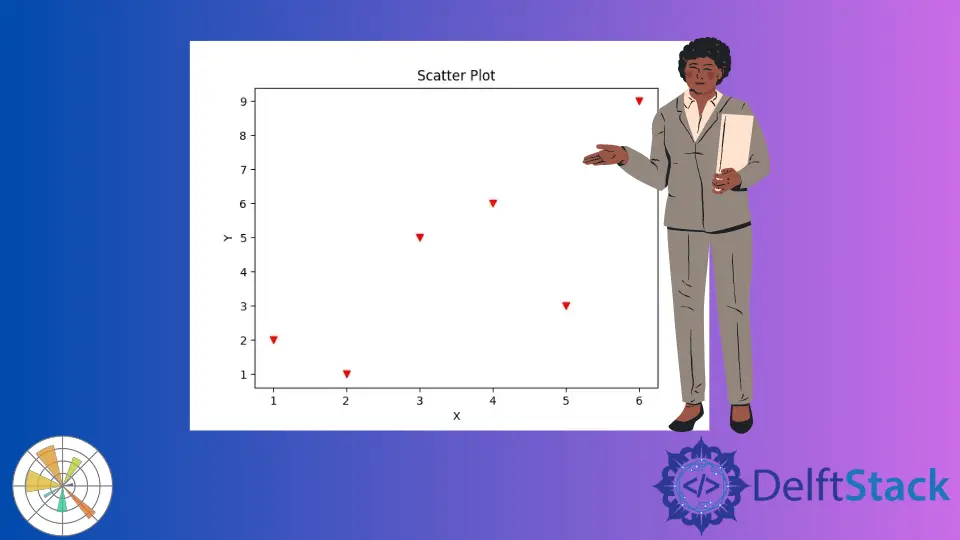
plt.scatter(x, y, color="red", marker="v")
plt.xlabel("X")
plt.ylabel("Y")
plt.title("Scatter Plot")
plt.show()
출력:

빨간색과 v마커가있는 산점도를 생성합니다.
matplotlib.pyplot.plot()메서드를 사용하여 데이터를 점으로 플로팅
기본적으로matplotlib.pyplot.plot()메서드는 모든 점을 단일 선으로 연결합니다. matplotlib.pyplot.plot()을 사용하여 산점도를 생성하려면 마커를 나타내는 문자를 메서드의 세 번째 인수로 설정합니다.
import matplotlib.pyplot as plt

x = [1, 2, 3, 4, 5, 6]
y = [2, 1, 5, 6, 3, 9]

plt.plot(
    x,
    y,
    "o",
    color="red",
)
plt.xlabel("X")
plt.ylabel("Y")
plt.title("Scatter Plot")
plt.show()
출력:

데이터 포인트를 나타내는 빨간색마커로 o를 사용하여 데이터에서 산점도를 생성합니다.
튜토리얼이 마음에 드시나요? DelftStack을 구독하세요 YouTube에서 저희가 더 많은 고품질 비디오 가이드를 제작할 수 있도록 지원해주세요. 구독하다
작가: Suraj Joshi
Suraj Joshi is a backend software engineer at Matrice.ai.
LinkedIn