Matplotlib의 twinx 및 twiny
-
Matplotlib Python의
matplotlib.axes.Axes.twinx() -
Matplotlib Python의
matplotlib.axes.Axes.twiny() -
Matplotlib
twinx()와twiny()를 함께 사용하십시오

이 튜토리얼에서는 Python에서matplotlib.axes.Axes.twinx()및matplotlib.axes.Axes.twiny()를 사용하여 공통 X 축 또는 Y 축으로 Matplotlib에서 쌍 축을 만드는 방법을 설명합니다.
Matplotlib Python의matplotlib.axes.Axes.twinx()
matplotlib.axes.Axes.twinx()함수는 Matplotlib Figure에 초기 축과 공통 X 축을 공유하는 다른 축을 생성합니다.
import matplotlib.pyplot as plt

students = ["Anil", "Sohit", "Hrishav", "Ayush", "Sunil"]
heights_in_cms = [165, 160, 140, 150, 130]

fig, axes = plt.subplots()
fig.set_size_inches(8, 6)
axes.bar(students, heights_in_cms)
y1, y2 = axes.get_ylim()
axes.set_xlabel("Students", fontsize=12)
axes.set_ylabel("Height in cms", fontsize=12)

twin_axes = axes.twinx()
twin_axes.set_ylim(y1 * 0.394, y2 * 0.394)
twin_axes.set_ylabel("Height in Inches", fontsize=12)

fig.suptitle("Plot using matplotlib.axes.Axes.twinx()", fontsize=15)
plt.show()
출력:
.webp)
학생들의 키에 대한 막대 플롯을 만듭니다. 왼쪽의 Y 축 레이블은 cm단위의 학생 키를 나타내고 오른쪽의 Y 축 레이블은 inches단위의 학생 키를 나타냅니다.
이 경우 X 축을axes와 공유하는 새 축twin_axes를 만듭니다. axes의 Y 축은 라벨이Height in cms로 설정되고twin_axes의Y 축은Height in Inches로 설정됩니다.
Matplotlib Python의matplotlib.axes.Axes.twiny()
matplotlib.axes.Axes.twiny()함수는 Matplotlib Figure에서 초기 축과 공통 Y 축을 공유하는 다른 축을 만듭니다.
import matplotlib.pyplot as plt

distance_in_kms = [10, 20, 30, 40, 50]
fare_in_dollars = [2, 3.5, 5, 7, 10]

fig, axes = plt.subplots()
fig.set_size_inches(10, 8)
axes.plot(distance_in_kms, fare_in_dollars)
x1, x2 = axes.get_xlim()
axes.set_xlabel("Distance in kms", fontsize=12)
axes.set_ylabel("Fare ($)", fontsize=12)

twin_axes = axes.twiny()
twin_axes.set_xlim(x1 * 0.62, x2 * 0.62)
twin_axes.set_xlabel("Distance in miles", fontsize=12)

fig.suptitle("Plot using matplotlib.axes.Axes.twiny()", fontsize=15)
plt.show()
출력:
.webp)
Y 축을axes와 공유하는 새 축twin_axes를 만듭니다. axes의 X 축은 레이블이Distance in kms로 설정되고twin_axes의 X 축은Distance in miles로 설정됩니다.
Matplotlib twinx()와twiny()를 함께 사용하십시오
import matplotlib.pyplot as plt

distance_in_kms = [10, 20, 30, 40, 50]
fare_in_dollars = [2, 3.5, 5, 7, 10]

fig, axes = plt.subplots()
fig.set_size_inches(10, 8)
axes.plot(distance_in_kms, fare_in_dollars)
x1, x2 = axes.get_xlim()
y1, y2 = axes.get_ylim()
axes.set_xlabel("Distance in kms", fontsize=12)
axes.set_ylabel("Fare ($)", fontsize=12)

twin_axes = axes.twinx().twiny()

twin_axes.set_ylim(y1 * 0.85, y2 * 0.85)
twin_axes.set_ylabel("Fare in Euros", fontsize=12)

twin_axes.set_xlim(x1 * 0.62, x2 * 0.62)
twin_axes.set_xlabel("Distance in miles", fontsize=12)

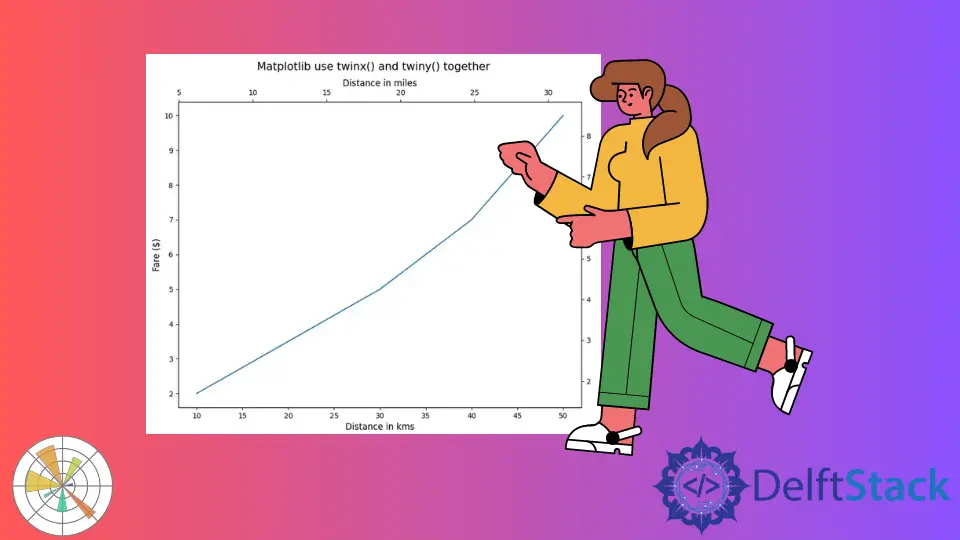
fig.suptitle("Matplotlib use twinx() and twiny() together", fontsize=15)
plt.show()
출력:
-and-twiny()-together.webp)
그림의 모든면에 눈금 표시가있는 Matplotlib 그림을 만듭니다. axes는 왼쪽 X 축과 하단 Y 축을 제어하고twin_axes는 오른쪽 X 축과 상단 Y 축을 제어합니다.
Suraj Joshi is a backend software engineer at Matrice.ai.
LinkedIn