Matplotlib에서 임의의 선 그리기
Suraj Joshi
2023년1월30일
Matplotlib
Matplotlib Lines
-
Matplotlib
matplotlib.pyplot.plot()메서드를 사용하여 임의의 선 그리기 -
Matplotlib
hlines()및vlines()메서드를 사용하여 임의의 선 그리기 -
Matplotlib
matplotlib.collections.LineCollection을 사용하여 임의의 선 그리기

이 튜토리얼에서는 matplotlib.pyplot.plot() 메서드를 사용하여 Matplotlib에서 임의의 선을 그리는 방법을 설명합니다. , matplotlib.pyplot.vlines() 메서드 또는 matplotlib.pyplot.hlines() 메소드 및 matplotlib.collections.LineCollection.
Matplotlib matplotlib.pyplot.plot()메서드를 사용하여 임의의 선 그리기
matplotlib.pyplot.plot()메서드를 사용하여 간단히 선을 그릴 수 있습니다. (x1,y1)에서 시작하여(x2,y2)로 끝나는 모든 행을 그리는 일반적인 구문은 다음과 같습니다.
plot([x1, x2], [y1, y2])
import matplotlib.pyplot as plt

plt.plot([3, 5], [1, 6], color="green")
plt.plot([0, 5], [0, 5], color="red")
plt.xlabel("X")
plt.ylabel("Y")
plt.title("Plot with 2 arbitrary Lines")
plt.show()
출력:

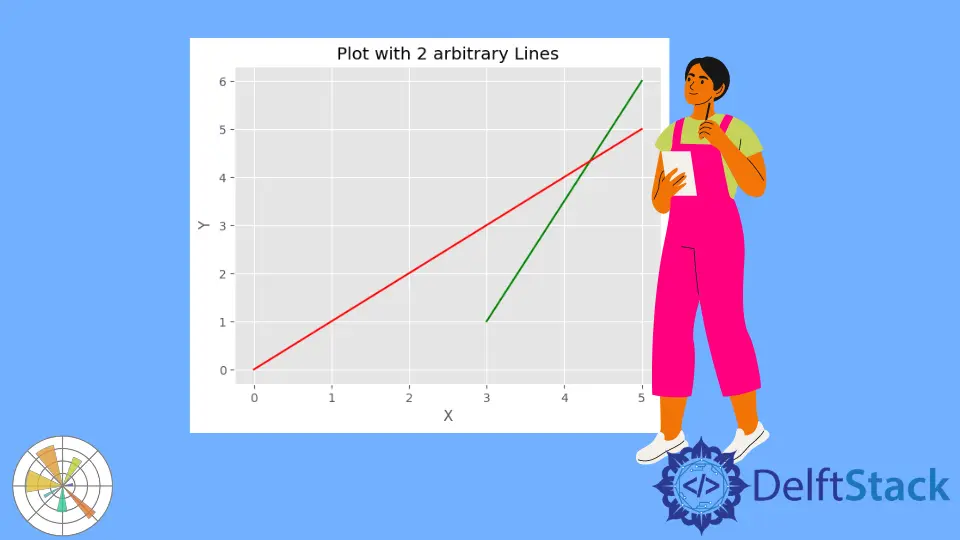
그림에서 두 개의 임의의 선을 그립니다. 녹색으로 표시되는 첫 번째 줄은 (3,1)에서 (5,6)까지 확장되고 빨간색으로 표시되는 두 번째 줄은 (0,0)에서 (5,5)까지 확장됩니다.
Matplotlib hlines()및vlines()메서드를 사용하여 임의의 선 그리기
hlines()및vlines()메서드를 사용하여 선을 그리는 일반적인 구문은 다음과 같습니다.
vlines(x, ymin, ymax)
hlines(y, xmin, xmax)
import matplotlib.pyplot as plt

plt.hlines(3, 2, 5, color="red")
plt.vlines(6, 1, 5, color="green")
plt.xlabel("X")
plt.ylabel("Y")
plt.title("Plot arbitrary Lines")
plt.show()
출력:

hlines()메서드는 Y 좌표가 선 전체에3으로 유지되고 X 좌표가2에서5까지 확장되는red색상의 수평선을 그립니다. vlines()메서드는 X 좌표가 선 전체에6으로 유지되고 Y 좌표가1에서5까지 확장되는green색상의 세로선을 그립니다.
Matplotlib matplotlib.collections.LineCollection을 사용하여 임의의 선 그리기
import matplotlib.pyplot as plt
from matplotlib import collections

line_1 = [(1, 10), (6, 9)]
line_2 = [(1, 7), (3, 6)]

collection_1_2 = collections.LineCollection([line_1, line_2], color=["red", "green"])

fig, axes = plt.subplots(1, 1)
axes.add_collection(collection_1_2)
axes.autoscale()
plt.show()
출력:

line_1 및line_2에서 선 모음을 생성 한 다음 모음을 플롯에 추가합니다.
튜토리얼이 마음에 드시나요? DelftStack을 구독하세요 YouTube에서 저희가 더 많은 고품질 비디오 가이드를 제작할 수 있도록 지원해주세요. 구독하다
작가: Suraj Joshi
Suraj Joshi is a backend software engineer at Matrice.ai.
LinkedIn