Matplotlib 에서 두 개의 히스토그램을 함께 플롯하는 방법
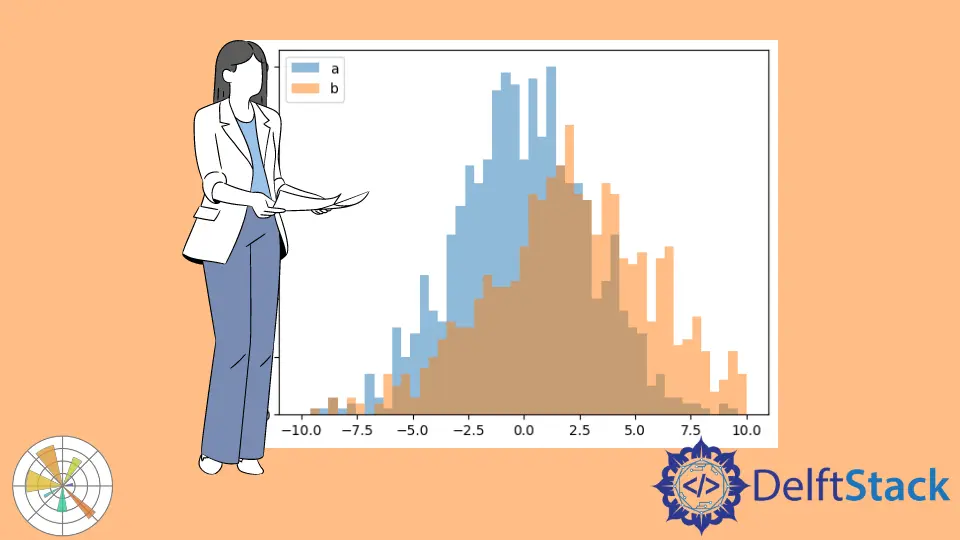
동시에 하나의 그림에 두 개의 히스토그램을 그릴 수 있습니다. 아래는 겹치는 막대가 있거나없는 두 개의 히스토그램을 만드는 방법을 보여줍니다. 겹치는 막대가없는 두 개의 히스토그램 작업 예제 코드: import numpy as np import matplotlib.pyplot as plt a = np.random.normal(0, 3, 3000) b = np.random.normal(2, 4, 2000) bins = np.linspace(-10, 10, 20) plt.hist([a, b], bins, label=["a", "b"]) plt.legend(loc="upper left") plt.show() 겹치는 막대가있는 두 개의 히스토그램 작업 예제 코드: import numpy as np import matplotlib.