Matplotlib チュートリアル - 軸ラベル
胡金庫
2024年2月15日

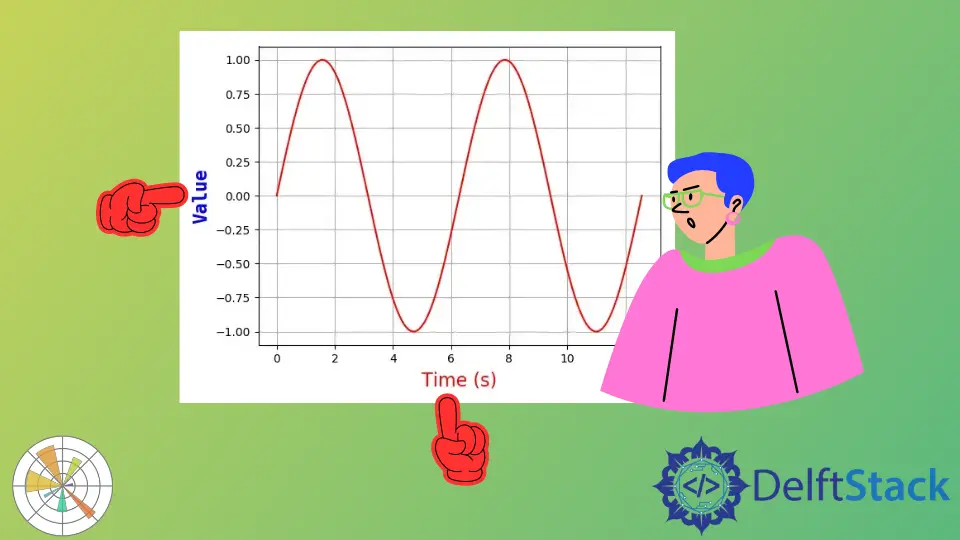
このチュートリアルでは、Matplotlib の軸ラベル、タイトル、および凡例について学習します。これらは、グラフがそのような種類のコンテキストで自明であることを助けることができます。
Matplotlib 軸ラベル
matplotlib.pyplot.xlabel(label, fontdict=None, labelpad=None, **kwargs)
X 軸のラベルを設定します。同様に、matplotlib.pyplot.ylabel は y 軸のラベルを設定します。
パラメーター
| 名前 | 説明 |
|---|---|
label |
ラベルテキスト |
fontdict |
ファミリー、色、重量、サイズなどのラベルテキストフォント辞書 |
labelpad |
ラベルと x 軸の間のポイントの間隔 |
# -*- coding: utf-8 -*-
import numpy as np
import matplotlib.pyplot as plt

x = np.linspace(0, 4 * np.pi, 1000)
y = np.sin(x)

plt.figure(figsize=(4, 3))

plt.plot(x, y, "r")
plt.xlabel("Time (s)", family="serif", color="r", weight="normal", size=16, labelpad=6)

plt.show()

以下の x 軸のラベルを指定し、
plt.xlabel("Time (s)", family="serif", color="r", weight="normal", size=16, labelpad=6)
以下は詳細な説明です、
-
Times(s)
これは x 軸のラベルテキストです
-
family = 'serif'
ラベルテキストフォントファミリを serif に指定します。[ 'serif' | 'sans-serif' | 'cursive' | 'fantasy' | 'monospace' ]
-
color = 'r'
フォントテキストの色は赤です。
より多くの色を選択するには、最後の章の色オプションを参照してください。
-
weight = 'normal'
ラベルテキストに通常のウェイトを指定します。
重量オプションは
['light'、 'normal'、 'medium'、 'semibold'、 'bold'、 'heavy'、 'black']
-
size = 16
フォントサイズを 16 に割り当てます。
-
labelpad = 6
x 軸とラベル間の距離は 6 ポイントです。
チュートリアルを楽しんでいますか? <a href="https://www.youtube.com/@delftstack/?sub_confirmation=1" style="color: #a94442; font-weight: bold; text-decoration: underline;">DelftStackをチャンネル登録</a> して、高品質な動画ガイドをさらに制作するためのサポートをお願いします。 Subscribe
