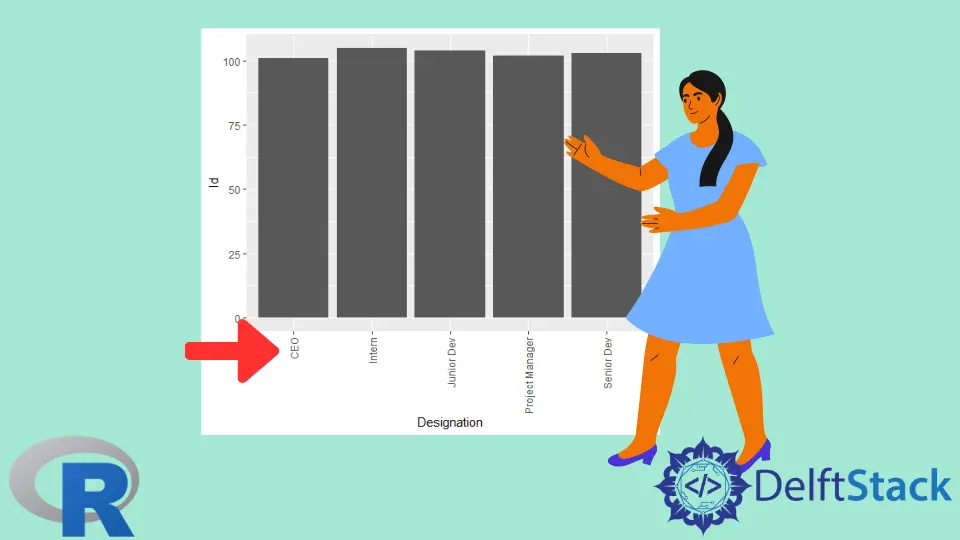
R で軸ラベルを回転する
- ベース R の軸ラベルを回転する
- 軸ラベルを水平方向に回転させる
- 軸ラベルを垂直に回転させる
- 軸に垂直な軸ラベルを回転させる
-
ggplotで軸ラベルを回転する -
ggplotで軸ラベルを 90 度に回転する -
ggplotで軸ラベルを 45 度に回転する

Base R と ggplot には、R で軸ラベルを回転させる方法が異なります。このチュートリアルでは、R で軸ラベルを回転させる方法を示します。
ベース R の軸ラベルを回転する
ベース R では、軸ラベルを軸に対して水平、垂直、または垂直に回転させることができます。最初にラベルを回転させるプロットを示し、その後、各方法を次のように示します。
サンプルコード:
# Create example Data
set.seed(99999)

xLabel <- rnorm(1000)
yLabel <- rnorm(1000)

# The Default Plot
plot(xLabel, yLabel)
出力:

軸ラベルを水平方向に回転させる
プロットに las=1 を渡すことで、軸ラベルを水平方向に回転させることができます。
サンプルコード:
# Create example Data
set.seed(99999)

xLabel <- rnorm(1000)
yLabel <- rnorm(1000)

# The Horizontal Axis Plot
plot(xLabel, yLabel, las=1)
上記のコードは、横軸ラベルを使用してプロットを作成します。
出力:

軸ラベルを垂直に回転させる
プロットに las=3 を渡すことで、軸ラベルを垂直に回転させることができます。
サンプルコード:
# Create example Data
set.seed(99999)

xLabel <- rnorm(1000)
yLabel <- rnorm(1000)

# The Vertical Axis Plot
plot(xLabel, yLabel, las=3)
上記のコードは、垂直軸ラベルを使用してプロットを作成します。
出力:

軸に垂直な軸ラベルを回転させる
プロットで las=2 を渡すことにより、軸ラベルを軸に垂直に回転させることができます。
サンプルコード:
# Create example Data
set.seed(99999)

xLabel <- rnorm(1000)
yLabel <- rnorm(1000)

# The Perpendicular Axis Plot
plot(xLabel, yLabel, las=2)
上記のコードは、軸ラベルに垂直なプロットを作成します。
出力:

las 値は、BaseR の任意のタイプのプロットで変更できます。
ggplot で軸ラベルを回転する
次の構文を使用して、ggplot2 の軸ラベルを回転させることができます。
plot + theme(axis.text.x = element_text(angle = 45, vjust = 1, hjust=1))
ラベルは 45 度の角度に回転し、vjust と hjust はラベルのテキストの垂直方向と水平方向の位置合わせを制御します。ggplot2 で軸ラベルを回転できるプロットを作成しましょう。
サンプルコード:
# Create example Data
Delftstack <- data.frame(Designation=c('CEO', 'Project Manager', 'Senior Dev', 'Junior Dev', 'Intern'),
                         Id=c(101, 102, 103, 104, 105))

#view the data
Delftstack

#plot the data using gglpot
library(ggplot2)

#create bar plot
ggplot(data=Delftstack, aes(x=Designation, y=Id)) +
  geom_bar(stat="identity")
上記のコードは、指定されたデータからデフォルトのプロットを作成します。
出力:

ggplot で軸ラベルを 90 度に回転する
ggplot2 で軸ラベルを 90 度回転させる角度に値 90 を与えることができます。
サンプルコード:
# Create example Data
Delftstack <- data.frame(Designation=c('CEO', 'Project Manager', 'Senior Dev', 'Junior Dev', 'Intern'),
                         Id=c(101, 102, 103, 104, 105))

#plot the data using gglpot2
library(ggplot2)

#create bar plot
ggplot(data=Delftstack, aes(x=Designation, y=Id)) +
  geom_bar(stat="identity") +
  theme(axis.text.x = element_text(angle=90, vjust=.5, hjust=1))
上記のコードは、軸を 90 度回転させた gglpot2 を作成します。
出力:

ggplot で軸ラベルを 45 度に回転する
ggplot2 で軸ラベルを 45 度回転させる角度に値 45 を与えることができます。
サンプルコード:
# Create example Data
Delftstack <- data.frame(Designation=c('CEO', 'Project Manager', 'Senior Dev', 'Junior Dev', 'Intern'),
                         Id=c(101, 102, 103, 104, 105))

#plot the data using gglpot2
library(ggplot2)

#create bar plot
ggplot(data=Delftstack, aes(x=Designation, y=Id)) +
  geom_bar(stat="identity") +
  theme(axis.text.x = element_text(angle=45, vjust=1, hjust=1))
上記のコードは、軸を 45 度回転させた gglpot を作成します。
出力:

Sheeraz is a Doctorate fellow in Computer Science at Northwestern Polytechnical University, Xian, China. He has 7 years of Software Development experience in AI, Web, Database, and Desktop technologies. He writes tutorials in Java, PHP, Python, GoLang, R, etc., to help beginners learn the field of Computer Science.
LinkedIn Facebook