Matplotlib でグラフ座標の凡例位置を指定する方法
Suraj Joshi
2024年2月15日
Matplotlib
Matplotlib Legend

凡例の位置は、loc パラメータの値を設定することで指定することができます。
例を挙げてみます。凡例の位置をグラフ座標で指定する Matplotlib
import matplotlib.pyplot as plt

x = [1, 2, 3]
y1 = [0.5 * i + 1 for i in x]
y2 = [2 * i + 1 for i in x]

fig, ax = plt.subplots(2, 1)

ax[0].plot(x, y1, "b-", label="0.5x+1")
ax[0].plot(x, y2, "g-", label="2x+1")
ax[0].legend(loc="best")

ax[1].plot(x, y1, "b-", label="0.5x+1")
ax[1].plot(x, y2, "g-", label="2x+1")
ax[1].legend(loc="lower left")

plt.tight_layout()
plt.show()
出力:

ここでは、2つのサブプロットを持つ図があります。一番上のサブプロットでは loc が best に設定されています。
同様のことが一番下の 2つ目のサブプロットでも起こります。外接枠は bbox_to_anchor パラメータで指定し、デフォルト値は (0,0,1,1) です。
パラメータ loc には以下の値のいずれかを指定します。
best |
upper right |
upper left |
lower left |
lower right |
right |
center left |
center right |
lower center |
upper center |
center |
これらの位置は、bbox_to_anchor パラメータで指定したバウンディングボックスに対する凡例の位置を表します。
同様に、bbox_to_anchor パラメータの値を変更することで、図の任意の位置に凡例を配置することができます。bbox_to_anchor パラメータには座標を表すタプルを指定します。
import matplotlib.pyplot as plt

x = [1, 2, 3]
y1 = [0.5 * i + 1 for i in x]
y2 = [2 * i + 1 for i in x]

fig, ax = plt.subplots(2, 1)

ax[0].plot(x, y1, "b-", label="Plot-1")
ax[0].plot(x, y2, "g-", label="Plot-2")
ax[0].legend(loc="upper left", bbox_to_anchor=(0.9, 0.75))
ax[0].scatter((0.9), (0.75), s=70, c="red", transform=ax[0].transAxes)

ax[1].plot(x, y1, "b-", label="Plot-1")
ax[1].plot(x, y2, "g-", label="Plot-2")
ax[1].legend(loc="center right", bbox_to_anchor=(0.6, 0.4))
ax[1].scatter((0.6), (0.4), s=70, c="red", transform=ax[1].transAxes)

plt.tight_layout()
plt.show()
出力:

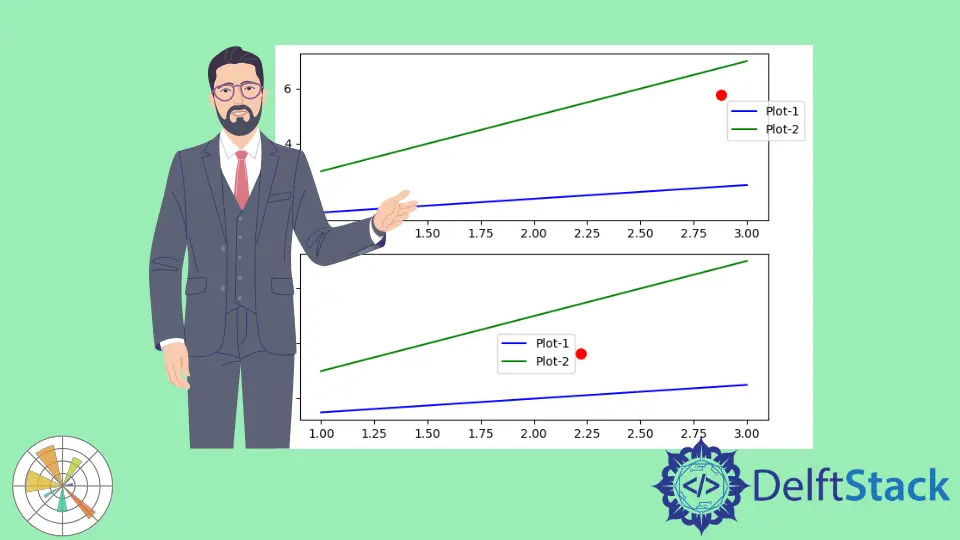
上部のサブプロットでは、bbox_to_anchor の値を (0.9,0.75) に設定しています。パラメータ loc の値 "upper left" は凡例の左上隅を表しており、赤い点の位置に配置されています。
下部のサブプロット bbox_to_anchor には (0.6,0.4) が設定されており、図の下軸の赤い点で示されています。また、loc の値は "center right" に設定されているので、図の下軸の凡例は赤い点の位置に center right の角があることになります。
チュートリアルを楽しんでいますか? <a href="https://www.youtube.com/@delftstack/?sub_confirmation=1" style="color: #a94442; font-weight: bold; text-decoration: underline;">DelftStackをチャンネル登録</a> して、高品質な動画ガイドをさらに制作するためのサポートをお願いします。 Subscribe
著者: Suraj Joshi
Suraj Joshi is a backend software engineer at Matrice.ai.
LinkedIn