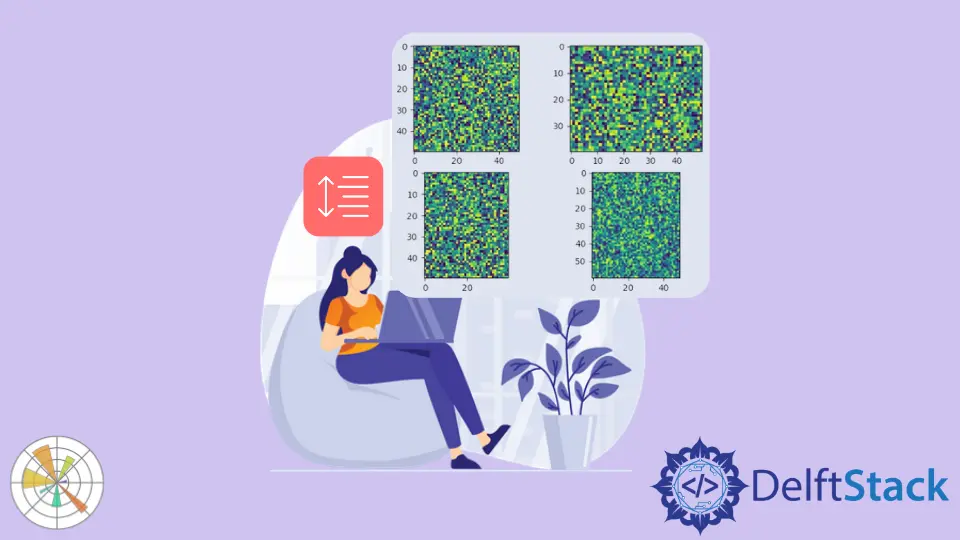
Matplotlib の多くのサブプロットでサブプロットのサイズまたは間隔を改善する方法
-
tight_layout()メソッド -
plt.subplots_adjust()メソッド -
plt.subplot_tool()メソッド -
サブプロット関数で
constrained_layout=Trueをアクティブ化

tight_layout()、subplots_adjust()、および subplot_tool() メソッドを使用して、Matplotlib の多くのサブプロットでサブプロットのサイズまたは間隔を改善できます。また、subplots() 関数で constrained_layout=True を設定して、サブプロットの間隔を改善することもできます。
tight_layout() メソッド
tight_layout() メソッドはサブプロット間の正しい間隔を自動的に維持します。
import numpy as np
import matplotlib.pyplot as plt

x = np.linspace(-3, 3, 100)
y1 = np.sin(x)
y2 = np.cos(x)
y3 = 1 / (1 + np.exp(-x))
y4 = np.exp(x)

fig, ax = plt.subplots(2, 2)

ax[0, 0].plot(x, y1)
ax[0, 1].plot(x, y2)
ax[1, 0].plot(x, y3)
ax[1, 1].plot(x, y4)

ax[0, 0].set_title("Sine function")
ax[0, 1].set_title("Cosine function")
ax[1, 0].set_title("Sigmoid function")
ax[1, 1].set_title("Exponential function")

fig.tight_layout()
plt.show()

tight_layout() メソッドを使用しない場合、1つの行が次の行のタイトルと重なります。
import numpy as np
import matplotlib.pyplot as plt

x = np.linspace(-3, 3, 100)
y1 = np.sin(x)
y2 = np.cos(x)
y3 = 1 / (1 + np.exp(-x))
y4 = np.exp(x)

fig, ax = plt.subplots(2, 2)

ax[0, 0].plot(x, y1)
ax[0, 1].plot(x, y2)
ax[1, 0].plot(x, y3)
ax[1, 1].plot(x, y4)

ax[0, 0].set_title("Sine function")
ax[0, 1].set_title("Cosine function")
ax[1, 0].set_title("Sigmoid function")
ax[1, 1].set_title("Exponential function")

plt.show()

plt.subplots_adjust() メソッド
plt.subplots_adjust() メソッドを使用して、サブプロット間の間隔を変更できます。
import numpy as np
import matplotlib.pyplot as plt

x = np.linspace(-3, 3, 100)
y1 = np.sin(x)
y2 = np.cos(x)
y3 = 1 / (1 + np.exp(-x))
y4 = np.exp(x)

fig, ax = plt.subplots(2, 2)

ax[0, 0].plot(x, y1)
ax[0, 1].plot(x, y2)
ax[1, 0].plot(x, y3)
ax[1, 1].plot(x, y4)

ax[0, 0].set_title("Sine function")
ax[0, 1].set_title("Cosine function")
ax[1, 0].set_title("Sigmoid function")
ax[1, 1].set_title("Exponential function")

plt.subplots_adjust(left=0.125, bottom=0.1, right=0.9, top=0.9, wspace=0.2, hspace=0.35)

plt.show()

plt.subplots_adjust(left=0.125, bottom=0.1, right=0.9, top=0.9, wspace=0.2, hspace=0.35)
wspace と hspace は、サブプロット間で予約されるスペースを指定します。これらは、それぞれ軸の幅と高さの割合です。
left、right、top、および bottom パラメーターは、サブプロットの 4 辺の位置を指定します。それらは、図の幅と高さの割合です。
plt.subplot_tool() メソッド
このメソッドは、Figure のサブプロットツールウィンドウを起動します。
import numpy as np
import matplotlib.pyplot as plt

im1 = np.random.random((50, 50))
im2 = np.random.random((40, 50))
im3 = np.random.random((50, 40))
im4 = np.random.random((60, 50))

plt.subplot(221)
plt.imshow(im1)
plt.subplot(222)
plt.imshow(im2)
plt.subplot(223)
plt.imshow(im3)
plt.subplot(224)
plt.imshow(im4)

plt.subplot_tool()
plt.show()

これは、ユーザーが subplot_tool 内のバーをドラッグしてサブプロットのレイアウトを変更するためのインタラクティブな方法を提供します。
サブプロット関数で constrained_layout=True をアクティブ化
constrained_layout は、サブプロットと装飾を自動的に調整して、図にできるだけ収まるようにします。
constrained_layout は、すべての描画ステップの前にレイアウトを最適化するため、サブプロットの作成前または作成中にアクティブにする必要があります。
import numpy as np
import matplotlib.pyplot as plt

a = np.linspace(0, 5, 100)

figure, axes = plt.subplots(2, 2, constrained_layout=True)

axes[0, 0].plot(x, np.exp(a))
axes[0, 1].plot(a, np.sin(a))
axes[1, 0].plot(a, np.cos(a))
axes[1, 1].plot(range(10))

axes[0, 0].set_title("subplot 1")
axes[0, 1].set_title("subplot 2")
axes[1, 0].set_title("subplot 3")
axes[1, 1].set_title("subplot 4")

plt.show()

Suraj Joshi is a backend software engineer at Matrice.ai.
LinkedIn