Matplotlib のサブプロットにタイトルを追加する方法
Suraj Joshi
2023年1月30日
Matplotlib
Matplotlib Subplot
-
Matplotlib のサブプロットにタイトルを追加する
Set_title()メソッド -
Matplotlib のサブプロットにタイトルを設定する
title.set_text()メソッド -
タイトルを Matplotlib のサブプロットに設定するための
plt.gca().set_title()/plt.gca.title.set_text()

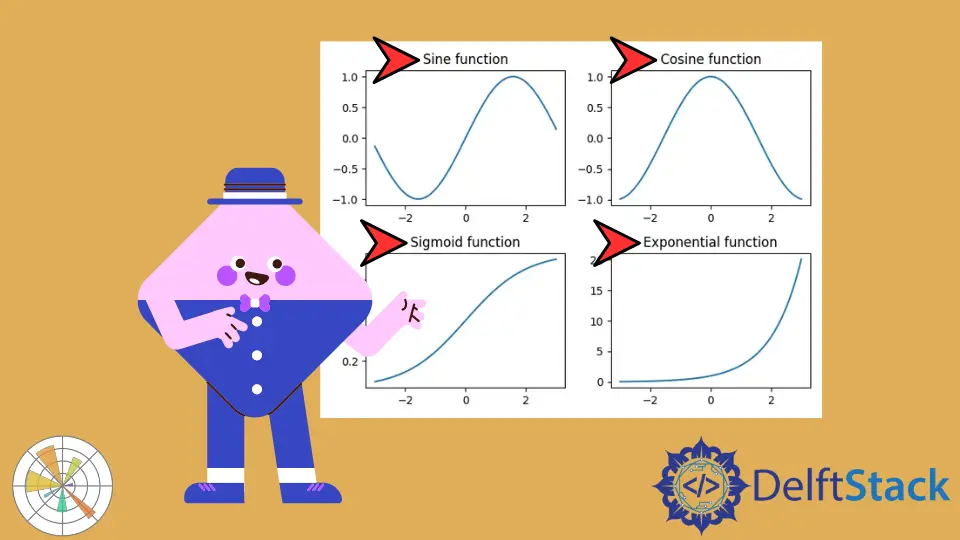
Matplotlib のサブプロットにタイトルを追加するには、set_title(label) および title.set_text(label) メソッドを使用します。
Matplotlib のサブプロットにタイトルを追加する Set_title() メソッド
matplotlib.axes._axes.Axes.set_title(label) メソッドを使用して、現在のサブプロット Axes のタイトル(文字列 label)を設定します。
import numpy as np
import matplotlib.pyplot as plt

x = np.linspace(-3, 3, 100)
y1 = np.sin(x)
y2 = np.cos(x)
y3 = 1 / (1 + np.exp(-x))
y4 = np.exp(x)

fig, ax = plt.subplots(2, 2)

ax[0, 0].plot(x, y1)
ax[0, 1].plot(x, y2)
ax[1, 0].plot(x, y3)
ax[1, 1].plot(x, y4)

ax[0, 0].set_title("Sine function")
ax[0, 1].set_title("Cosine function")
ax[1, 0].set_title("Sigmoid function")
ax[1, 1].set_title("Exponential function")

fig.tight_layout()
plt.show()
出力:

いくつかのサブプロットをループして、タイトルとともに一度に 1つずつ表示したい場合は、次の短いコードを使用できます。
import numpy as np
import matplotlib.pyplot as plt

x = np.linspace(-3, 3, 100)
y = [0, 0, 0, 0]
y[0] = np.sin(x)
y[1] = np.cos(x)
y[2] = 1 / (1 + np.exp(-x))
y[3] = np.exp(x)

figure, ax = plt.subplots(2, 2)
i = 0
for a in range(len(ax)):
    for b in range(len(ax[a])):
        ax[a, b].plot(x, y[i])
        subplot_title = "Subplot" + str(i)
        ax[a, b].set_title(subplot_title)
        i = i + 1

figure.tight_layout()
plt.show()
出力:

Matplotlib のサブプロットにタイトルを設定する title.set_text() メソッド
set_title() メソッドと同様の方法で title.set_text() メソッドを使用して Matplotlib のサブプロットにタイトルを追加することもできます。
import numpy as np
import matplotlib.pyplot as plt

x = np.linspace(-3, 3, 100)
y1 = np.sin(x)
y2 = np.cos(x)
y3 = 1 / (1 + np.exp(-x))
y4 = np.exp(x)

fig, ax = plt.subplots(2, 2)

ax[0, 0].plot(x, y1)
ax[0, 1].plot(x, y2)
ax[1, 0].plot(x, y3)
ax[1, 1].plot(x, y4)

ax[0, 0].title.set_text("Sine function")
ax[0, 1].title.set_text("Cosine function")
ax[1, 0].title.set_text("Sigmoid function")
ax[1, 1].title.set_text("Exponential function")

fig.tight_layout()
plt.show()
出力:

タイトルを Matplotlib のサブプロットに設定するための plt.gca().set_title() / plt.gca.title.set_text()
インタラクティブなプロットで Matlab のようなスタイルを使用する場合、plt.gca() を使用してサブプロットの現在の Axes の参照を取得し、set_title() または title.set_text() メソッドを組み合わせることができますタイトルを Matplotlib のサブプロットに設定します。
import matplotlib.pyplot as plt

plt.subplots(2, 2)
x = [1, 2, 3]
y = [2, 4, 6]

for i in range(4):
    plt.subplot(2, 2, i + 1)
    plt.plot(x, y)
    plt.gca().set_title("Title-" + str(i))

plt.show()

plt.tight_layout()
または、
import matplotlib.pyplot as plt

plt.subplots(2, 2)
x = [1, 2, 3]
y = [2, 4, 6]

for i in range(4):
    plt.subplot(2, 2, i + 1)
    plt.plot(x, y)
    plt.gca().title.set_text("Title-" + str(i))

plt.show()

plt.tight_layout()
チュートリアルを楽しんでいますか? <a href="https://www.youtube.com/@delftstack/?sub_confirmation=1" style="color: #a94442; font-weight: bold; text-decoration: underline;">DelftStackをチャンネル登録</a> して、高品質な動画ガイドをさらに制作するためのサポートをお願いします。 Subscribe
著者: Suraj Joshi
Suraj Joshi is a backend software engineer at Matrice.ai.
LinkedIn