Matplotlib でビンのサイズを手動で設定する方法
Suraj Joshi
2023年1月30日
Matplotlib
Matplotlib Histogram

Matplotlib でヒストグラムを描画するには、ビンの数 n がパラメーターとして渡される hist2d() 関数を使用します。必要なサイズを維持するために必要なビンの数を計算することにより、ビンのサイズを設定できます。
hist() 関数へのパラメーターとしてのビンの境界
hist 関数の構文:
hist(x,
     bins: NoneType=None,
     range: NoneType=None,
     density: NoneType=None,
     weights: NoneType=None,
     cumulative: bool=False,
     bottom: NoneType=None,
     histtype: str=builtins.str,
     align: str=builtins.str,
     orientation: str=builtins.str,
     rwidth: NoneType=None,
     log: bool=False,
     color: NoneType=None,
     label: NoneType=None,
     stacked: bool=False,
     normed: NoneType=None,
     data: NoneType=None,
     **kwargs)
Matplotlib でビンのサイズを設定するには、ビンの数ではなく、ビンの境界を持つリストを bin パラメーターとして渡します。
import numpy as np
import numpy.random as random
import matplotlib.pyplot as plt

data = np.random.random_sample(100) * 100.0
plt.hist(data, bins=[0, 10, 20, 30, 40, 50, 60, 80, 100])
plt.xlabel("Value")
plt.ylabel("Counts")
plt.title("Histogram Plot of Data")
plt.grid(True)
plt.show()

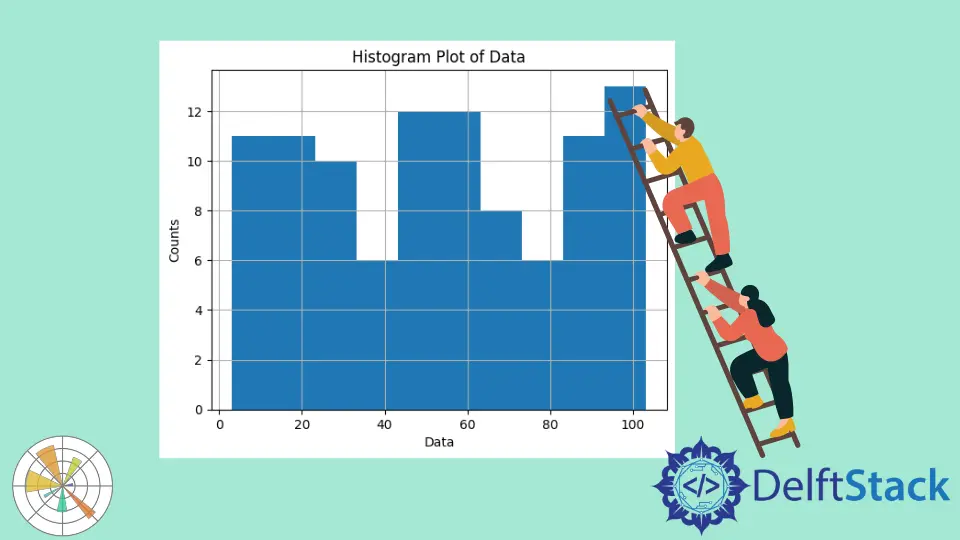
上記の例では、ビンの境界と間接的にビンの幅を手動で設定しました。np.arange を使用して等間隔の境界を見つけることもできます
ビンを等間隔にするには、np.arange を使用して等間隔の境界を見つけます
import numpy as np
import numpy.random as random
import matplotlib.pyplot as plt

binwidth = 10
data = np.random.random_sample(100) * 100.0
plt.hist(data, bins=np.arange(min(data), max(data) + binwidth, binwidth))
plt.xlabel("Data")
plt.ylabel("Counts")
plt.title("Histogram Plot of Data")
plt.grid(True)
plt.show()

警告
np.arange(start, stop, step) によって作成された間隔には start が含まれるため、np.arange の 2 番目のパラメーターは max(data) + binwidth になりますが、max(data) にはなりません stop を除外します。したがって、max(data) として実際の停止を行うには、max(data) に間隔 binwidth を追加する必要があります。希望する幅からビンの数を計算する
ビンの数を求めるには、希望のビンの幅で割った(最大値-最小値)の上限を計算します。
import numpy as np
import matplotlib.pyplot as plt


def find_bins(observations, width):
    minimmum = np.min(observations)
    maximmum = np.max(observations)
    bound_min = -1.0 * (minimmum % width - minimmum)
    bound_max = maximmum - maximmum % width + width
    n = int((bound_max - bound_min) / width) + 1
    bins = np.linspace(bound_min, bound_max, n)
    return bins


data = np.random.random_sample(120) * 100
bins = find_bins(data, 10.0)
plt.hist(data, bins=bins)
plt.xlabel("Data")
plt.ylabel("Counts")
plt.title("Histogram Plot")
plt.show()

チュートリアルを楽しんでいますか? <a href="https://www.youtube.com/@delftstack/?sub_confirmation=1" style="color: #a94442; font-weight: bold; text-decoration: underline;">DelftStackをチャンネル登録</a> して、高品質な動画ガイドをさらに制作するためのサポートをお願いします。 Subscribe
著者: Suraj Joshi
Suraj Joshi is a backend software engineer at Matrice.ai.
LinkedIn