Pandas DataFrame DataFrame.boxplot() 関数
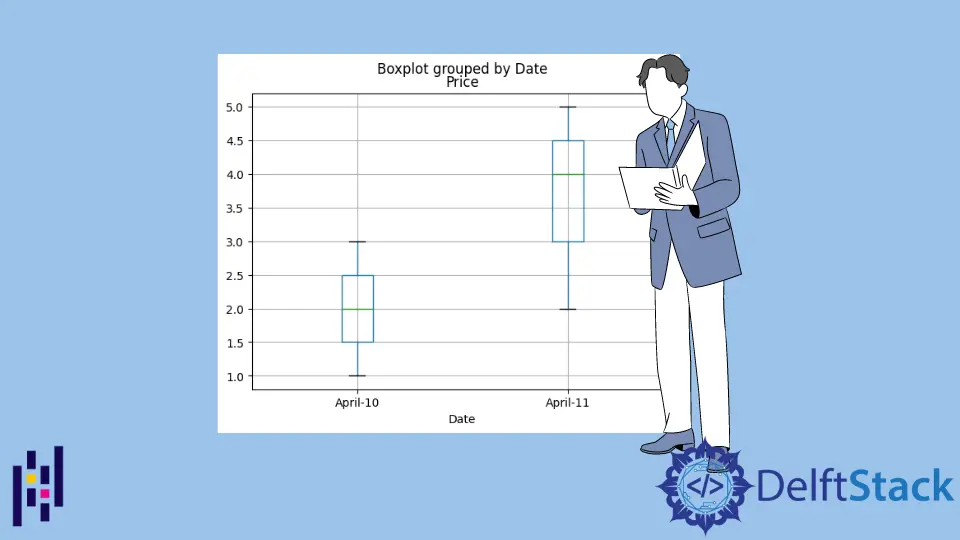
pandas.DataFrame.boxplot() は、DataFrame の列からボックス&ウィスカプロットを作成します。箱ひげ図は、データの最小値、四分位の第一値、中央値、四分位の第三値、最大値をまとめたものです。 pandas.DataFrame.boxplot() の構文 DataFrame.boxplot( column=None, by=None, ax=None, fontsize=None, rot=0, grid=True, figsize=None, layout=None, return_type=None, backend=None, **kwargs ) パラメータ column boxplot を生成するためのカラム名 by 異なるグループに by 列をグループ化して異なるボックスプロットを作成します。 ax boxplot で使用される Matplotlib の軸 grid ブール値です。グリッドをオン(True)とオフ(False)にします。 rot 整数。X 軸に沿ったラベルの回転角度 fontsize Boxplot のラベルのフォントサイズ layout Boxplot のレイアウトを制御または設定するために使用されるパラメータ return_type 返されるオブジェクトの型 backend オプション plotting.