Come ruotare il testo dell'etichetta sull'asse X in Matplotlib
-
plt.xticks(rotation= )per ruotare il testo dell’etichetta Xticks -
fig.autofmt_xdate(rotation= )per ruotare il testo dell’etichetta Xticks -
ax.set_xticklabels(xlabels, Rotation= )per ruotare il testo dell’etichetta Xticks -
plt.setp(ax.get_xticklabels(), Rotation=)per ruotare il testo dell’etichetta Xticks -
ax.tick_params(axis='x', Labelrotation= )per ruotare il testo delle etichette di Xtick -
Allineamento
xticklabelsruotato

In questo articolo del tutorial, introdurremo diversi metodi per ruotare il testo dell’etichetta dell’asse X in Python. Esso include,
plt.xticks(rotation= )fig.autofmt_xdate(rotation= )ax.set_xticklabels(xlabels, rotation= )plt.setp(ax.get_xticklabels(), rotation=)ax.tick_params(axis='x', labelrotation= )
L’orientamento predefinito del testo delle etichette di spunta sull’asse delle x è orizzontale o di 0 grado. Porta inconvienza se il testo delle etichette di spunta è troppo lungo, come la sovrapposizione tra testi di etichette adiacenti.
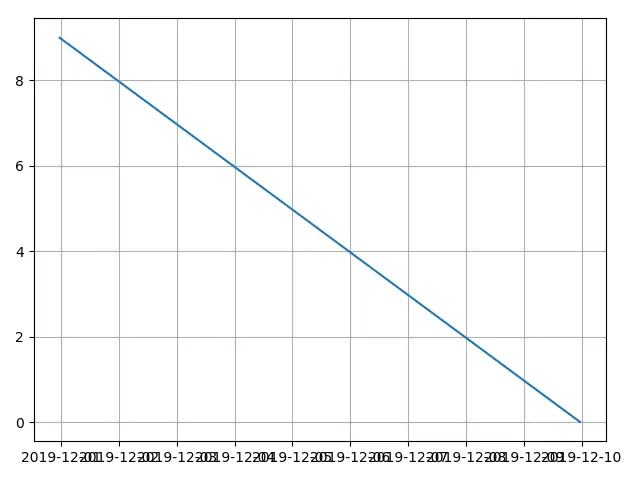
I codici per creare la figura di cui sopra sono,
from matplotlib import pyplot as plt
from datetime import datetime, timedelta

values = range(10)
dates = [datetime.now() - timedelta(days=_) for _ in range(10)]

fig, ax = plt.subplots()
plt.plot(dates, values)
plt.grid(True)

plt.show()
plt.xticks(rotation= ) per ruotare il testo dell’etichetta Xticks
from matplotlib import pyplot as plt
from datetime import datetime, timedelta

values = range(10)
dates = [datetime.now() - timedelta(days=_) for _ in range(10)]

fig, ax = plt.subplots()
plt.plot(dates, values)
plt.xticks(rotation=45)
plt.grid(True)

plt.show()
plt.xticks(rotation=45)
plt.xticks ottiene o imposta le proprietà delle posizioni dei tick e delle etichette dell’asse x.
rotation è l’angolo di rotazione in senso antiorario del testo delle etichette dell’asse x.
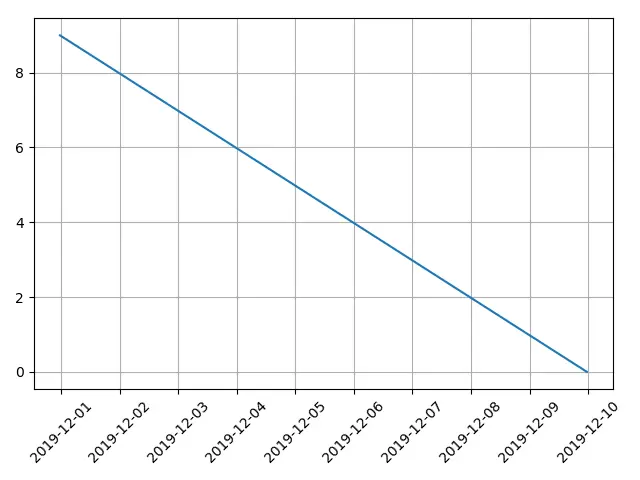
fig.autofmt_xdate(rotation= ) per ruotare il testo dell’etichetta Xticks
from matplotlib import pyplot as plt
from datetime import datetime, timedelta

values = range(10)
dates = [datetime.now() - timedelta(days=_) for _ in range(10)]

fig, ax = plt.subplots()
plt.plot(dates, values)
fig.autofmt_xdate(rotation=45)
plt.grid(True)

plt.show()
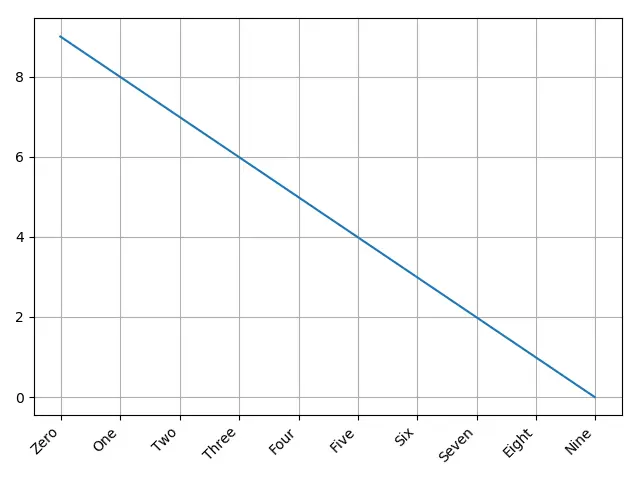
autofmt_xdate ruota le etichette di spunta e le allinea automaticamente a destra se l’etichetta è l’oggetto date.
Ma in realtà funziona non solo con l’oggetto date ma anche con la normale stringa di testo dell’etichetta.
from matplotlib import pyplot as plt
from datetime import datetime, timedelta

values = range(10)
dates = [datetime.now() - timedelta(days=_) for _ in range(10)]
xlabels = [
    "Zero",
    "One",
    "Two",
    "Three",
    "Four",
    "Five",
    "Six",
    "Seven",
    "Eight",
    "Nine",
]

fig, ax = plt.subplots()
plt.plot(dates, values)
ax.set_xticklabels(xlabels)
fig.autofmt_xdate(rotation=45)
plt.grid(True)

plt.show()
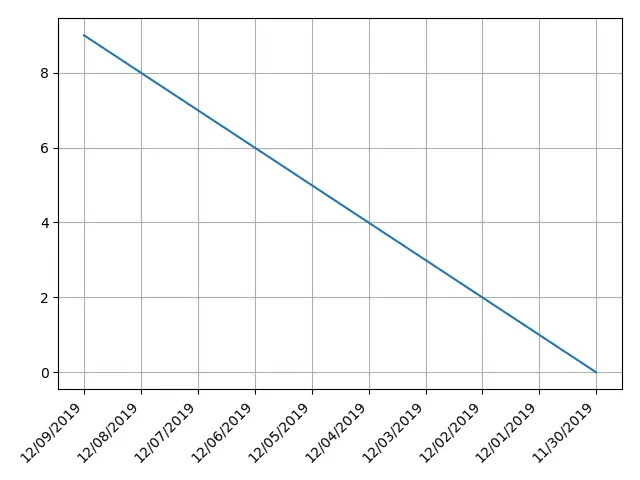
ax.set_xticklabels(xlabels, Rotation= ) per ruotare il testo dell’etichetta Xticks
set_xticklabels imposta le etichette x-tick con l’lista delle etichette di stringa.
Questa lista di etichette di stringa potrebbe essere una lista appena specificata o la lista di etichette esistente del grafico corrente letta da get_xticklabels().
from matplotlib import pyplot as plt
from datetime import datetime, timedelta

values = range(10)
dates = [datetime.now() - timedelta(days=_) for _ in range(10)]
xlabels = [
    datetime.strftime(datetime.now() - timedelta(days=_), "%m/%d/%Y") for _ in range(10)
]

fig, ax = plt.subplots()
plt.plot(dates, values)
ax.set_xticklabels(xlabels, rotation=45, ha="right")
plt.grid(True)

plt.show()
plt.setp(ax.get_xticklabels(), Rotation=) per ruotare il testo dell’etichetta Xticks
matplotlib.pyplot.setp imposta una proprietà su un oggetto artista.
plt.setp(ax.get_xticklabels(), rotation=) imposta la proprietà rotation dell’oggetto xtick labels.
from matplotlib import pyplot as plt
from datetime import datetime, timedelta

values = range(10)
dates = [datetime.now() - timedelta(days=_) for _ in range(10)]
xlabels = [
    datetime.strftime(datetime.now() - timedelta(days=_), "%m/%d/%Y") for _ in range(10)
]

fig, ax = plt.subplots()
plt.plot(dates, values)
plt.setp(ax.get_xticklabels(), rotation=45, ha="right")
plt.grid(True)

plt.tight_layout()

plt.show()
ax.tick_params(axis='x', Labelrotation= ) per ruotare il testo delle etichette di Xtick
tick_params imposta i parametri dei tick, delle etichette dei tick e delle griglie.
ax.tick_params(axis='x', labelrotation= ) imposta la proprietà labelrotation della spunta etichetta in asse x, o in altre parole, asse X.
from matplotlib import pyplot as plt
from datetime import datetime, timedelta

values = range(10)
dates = [datetime.now() - timedelta(days=_) for _ in range(10)]
xlabels = [
    datetime.strftime(datetime.now() - timedelta(days=_), "%m/%d/%Y") for _ in range(10)
]

fig, ax = plt.subplots()
plt.plot(dates, values)

ax.tick_params(axis="x", labelrotation=45)
plt.grid(True)

plt.show()
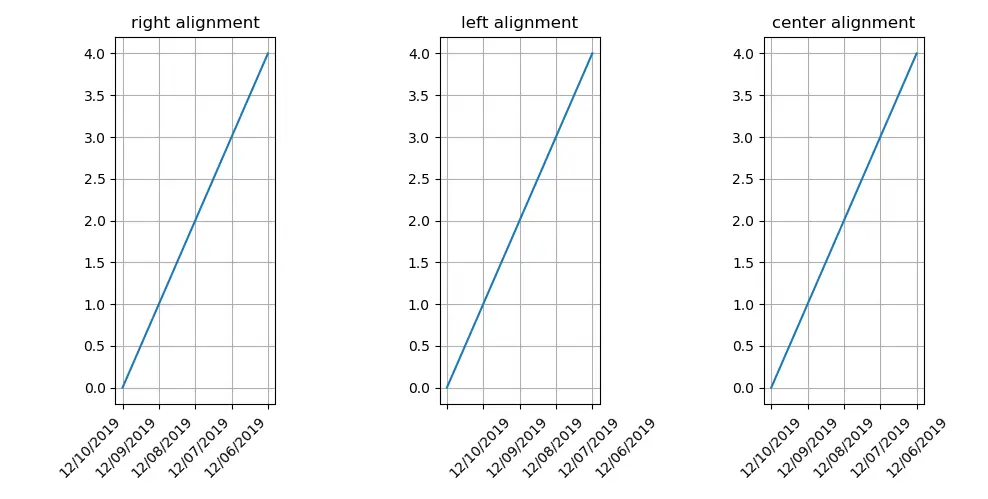
Allineamento xticklabels ruotato
usiamo l’argomento ha='right' nei codici di esempio di cui sopra, che significa horizzontale al’allineamento è right.
ha='right' allinea l’estremità destra del testo dell’etichetta ai ticks.
ha='left' allinea l’estremità sinistra del testo dell’etichetta ai ticks.
ha='center' allinea il centro del testo dell’etichetta ai ticks.
from matplotlib import pyplot as plt
from datetime import datetime, timedelta

xvalues = range(5)
yvalues = xvalues
xlabels = [
    datetime.strftime(datetime.now() - timedelta(days=_), "%m/%d/%Y") for _ in xvalues
]

alignment = ["right", "left", "center"]
fig, axes = plt.subplots(1, 3)


for n, ax in enumerate(axes):
    ax.plot(xvalues, yvalues)
    ax.set_title(alignment[n] + "alignment")
    ax.set_xticks(xvalues)
    ax.set_xticklabels(xlabels, rotation=45, ha=alignment[n])
    ax.grid(True)

plt.show()

Founder of DelftStack.com. Jinku has worked in the robotics and automotive industries for over 8 years. He sharpened his coding skills when he needed to do the automatic testing, data collection from remote servers and report creation from the endurance test. He is from an electrical/electronics engineering background but has expanded his interest to embedded electronics, embedded programming and front-/back-end programming.
LinkedIn FacebookArticolo correlato - Matplotlib Axes
- Come impostare le dimensioni dei caratteri delle etichette in Matplotlib
- Aggiungi un'etichetta dell'asse Y all'asse Y secondario in Matplotlib
- Traccia assi logaritmici in Matplotlib
- Crea un grafico quadrato con assi uguali in Matplotlib
- Imposta i limiti per gli assi in Matplotlib