Traccia due istogrammi insieme in Matplotlib

Potremmo tracciare due istogrammi in una figura contemporaneamente. Di seguito vengono mostrati i metodi per creare i due istogrammi con e senza barre sovrapposte.
Due istogrammi senza barre sovrapposte
Codici di esempio di lavoro:
import numpy as np
import matplotlib.pyplot as plt

a = np.random.normal(0, 3, 3000)
b = np.random.normal(2, 4, 2000)

bins = np.linspace(-10, 10, 20)

plt.hist([a, b], bins, label=["a", "b"])
plt.legend(loc="upper left")
plt.show()

Due istogrammi con barre sovrapposte
Codici di esempio di lavoro:
import numpy as np
import matplotlib.pyplot as plt

a = np.random.normal(0, 3, 1000)
b = np.random.normal(2, 4, 900)

bins = np.linspace(-10, 10, 50)

plt.hist(a, bins, alpha=0.5, label="a")
plt.hist(b, bins, alpha=0.5, label="b")
plt.legend(loc="upper left")

plt.show()

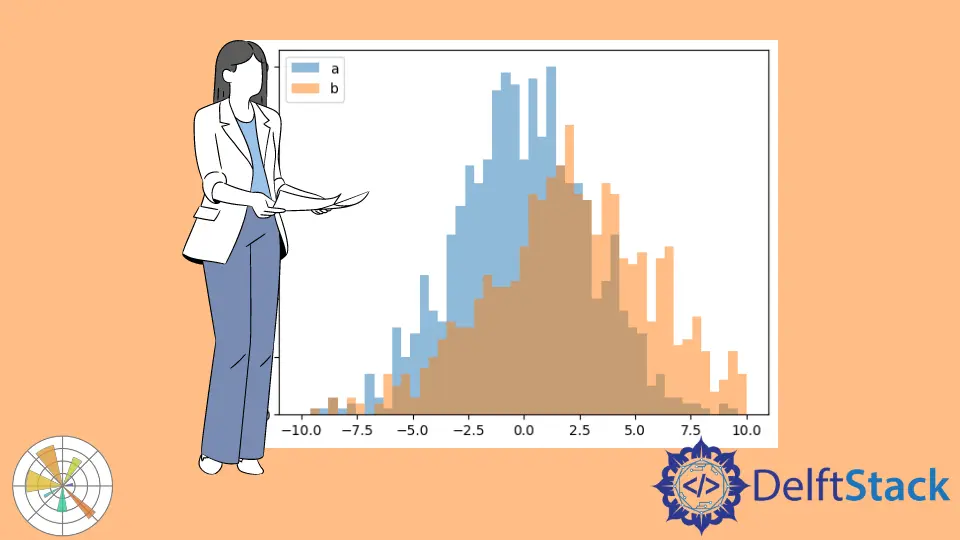
Quando chiamiamo plt.hist due volte per tracciare gli istogrammi individualmente, i due istogrammi avranno le barre sovrapposte come puoi vedere sopra.
La proprietà alpha specifica la trasparenza del grafico. 0.0 è trasparente e 1.0 è opaco.
Quando alpha è impostato su 0,5 per entrambi gli istogrammi, l’area sovrapposta mostra il colore combinato. Ma se alpha è 0.0, il valore predefinito, la barra sovrapposta mostra solo il colore del valore più alto tra due istogrammi e l’altro colore è nascosto, come mostrato di seguito.

Founder of DelftStack.com. Jinku has worked in the robotics and automotive industries for over 8 years. He sharpened his coding skills when he needed to do the automatic testing, data collection from remote servers and report creation from the endurance test. He is from an electrical/electronics engineering background but has expanded his interest to embedded electronics, embedded programming and front-/back-end programming.
LinkedIn Facebook