How to Change Location of Legend in Seaborn Plot
-
Method 1: Using the
locParameter inlegend() -
Method 2: Using
bbox_to_anchorfor Custom Positioning - Method 3: Adjusting Legend Size and Frame
- Conclusion
- FAQ

If you’re diving into data visualization with Python, you’ve likely come across Seaborn, a powerful library that makes creating attractive plots a breeze. One common aspect of visualizations is the legend, which helps convey information about the data represented. However, sometimes the default position of the legend may not suit your needs or might even obstruct important data points.
In this tutorial, we will explore how to change the position of the legend in a Seaborn plot. By the end, you’ll be equipped with the knowledge to customize your plots effectively, ensuring that they not only look great but also communicate your data clearly. Let’s get started!
Method 1: Using the loc Parameter in legend()
One of the simplest ways to change the legend’s position in a Seaborn plot is by using the loc parameter within the legend() function. This method allows you to specify the location of the legend with predefined string codes or numeric values.
Here’s how to do it:
import seaborn as sns
import matplotlib.pyplot as plt

# Load an example dataset
tips = sns.load_dataset("tips")

# Create a scatter plot
sns.scatterplot(data=tips, x="total_bill", y="tip", hue="day")

# Change the legend location
plt.legend(loc='upper right')

# Show the plot
plt.show()
Output:
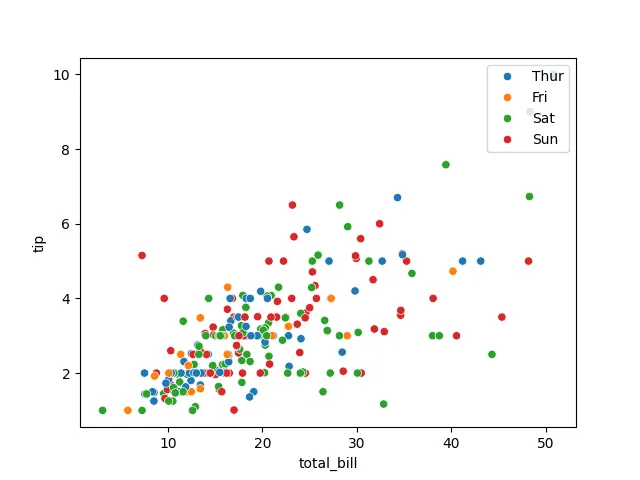
In this code, we first import the necessary libraries and load the “tips” dataset. We create a scatter plot to visualize the relationship between total bills and tips, categorized by the day of the week. The crucial part is the plt.legend(loc='upper right'), where we specify that we want the legend to appear in the upper right corner of the plot. You can also use other locations like 'lower left', 'center', or even numeric values like 0 for ‘best’ and 1 for ‘upper right’.
This method is straightforward and effective for quickly adjusting the legend’s position to enhance the clarity of your visualizations.
Method 2: Using bbox_to_anchor for Custom Positioning
If you need more control over the legend’s placement, the bbox_to_anchor parameter allows you to specify the exact location of the legend. This method is particularly useful when you want to position the legend outside the plot area or in a specific coordinate.
Here’s an example:
import seaborn as sns
import matplotlib.pyplot as plt

# Load an example dataset
tips = sns.load_dataset("tips")

# Create a scatter plot
sns.scatterplot(data=tips, x="total_bill", y="tip", hue="day")

# Change the legend location using bbox_to_anchor
plt.legend(loc='upper left', bbox_to_anchor=(1, 1))

# Show the plot
plt.show()
Output:
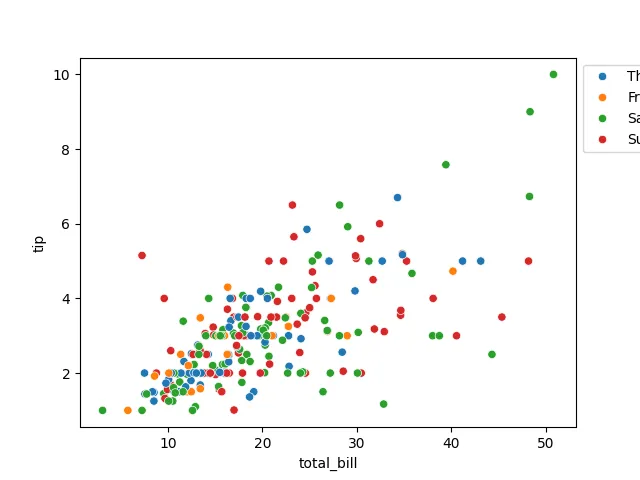
In this example, we again create a scatter plot using the “tips” dataset. The key difference lies in the plt.legend(loc='upper left', bbox_to_anchor=(1, 1)) line. Here, loc='upper left' specifies the anchor point of the legend, while bbox_to_anchor=(1, 1) moves the legend to the coordinates (1, 1), which is outside the plot area. Let’s explain it in details below.
loc='upper left': It specifies the reference point within the legend box itself. In this case, it means the upper left corner of the legend box.
bbox_to_anchor=(1, 1): This is the crucial part. It determines the position of the legend box’s reference point (specified by loc) relative to the axes.
(1, 1)means that the upper right corner of the axes (the plot area) is the anchor point.- Because we have set
loc='upper left', the upper left corner of the legend is being placed at the upper right corner of the axes. - Essentially, the upper left of the legend box is being placed at the coordinate
(1,1)of the axes. This coordinate is the upper right hand corner of the plot. Therefore, the legend is placed outside and to the upper right of the plot.
You can adjust these coordinates to place the legend exactly where you want it. This flexibility is invaluable for creating clean, unobstructed visualizations, especially in complex plots.
Method 3: Adjusting Legend Size and Frame
Sometimes, merely changing the position of the legend isn’t enough. You might also want to adjust its size or remove the frame for a cleaner look. By customizing the legend’s appearance, you can enhance the overall aesthetics of your Seaborn plots.
Here’s how to do it:
import seaborn as sns
import matplotlib.pyplot as plt

# Load an example dataset
tips = sns.load_dataset("tips")

# Create a scatter plot
sns.scatterplot(data=tips, x="total_bill", y="tip", hue="day")

# Customize the legend
legend = plt.legend(loc='best', frameon=False, fontsize='small')

# Show the plot
plt.show()
Output:
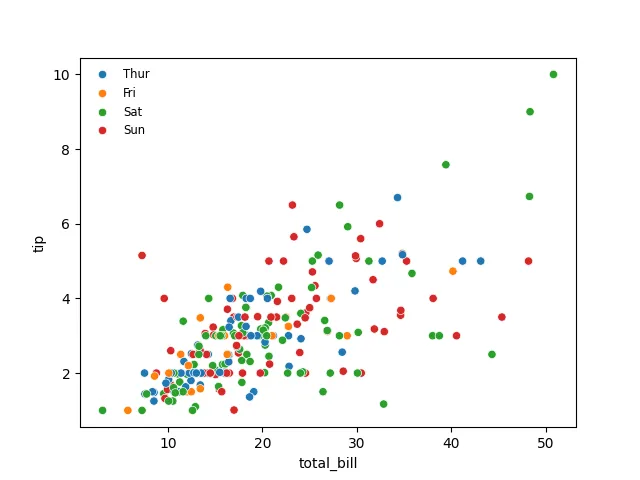
In this code snippet, we create a scatter plot as before. The key line here is plt.legend(loc='best', frameon=False, fontsize='small'), which does several things: it places the legend in the best location based on data (loc='best'), removes the legend’s frame (frameon=False), and sets the font size to small. This approach not only changes the legend’s position but also enhances its appearance, making it less intrusive and more visually appealing. Such customizations can significantly improve the readability of your plots, especially when dealing with multiple categories.
Conclusion
In this tutorial, we explored various methods to change the location of the legend in a Seaborn plot. Whether you prefer the simplicity of the loc parameter, the precision of bbox_to_anchor, or the aesthetic adjustments of legend size and frame, Seaborn provides flexible options to tailor your visualizations. By mastering these techniques, you can create plots that not only convey information effectively but also look polished and professional. Happy plotting!
FAQ
-
How can I change the legend title in a Seaborn plot?
You can change the legend title by using thetitleparameter in thelegend()function. For example,plt.legend(title='My Legend Title'). -
Can I customize the legend labels in Seaborn?
Yes, you can customize the legend labels by passing a list of strings to thelabelsparameter in thelegend()function. -
What if I want to remove the legend entirely?
You can remove the legend by callingplt.legend().remove()after plotting your data. -
Is it possible to have multiple legends in a Seaborn plot?
While Seaborn does not support multiple legends directly, you can create additional legends by using multiple calls toplt.legend()with different data subsets.
- How do I save the plot with the legend in a specific position?
After adjusting the legend’s position, you can save the plot usingplt.savefig('filename.png'), ensuring the legend appears as intended in the saved file.

Manav is a IT Professional who has a lot of experience as a core developer in many live projects. He is an avid learner who enjoys learning new things and sharing his findings whenever possible.
LinkedIn