How to Change Font Size in Seaborn Plot
-
Method 1: Using the
fontsizeParameter -
Method 2: Using
set_context() -
Method 3: Customizing Font Size with
rcParams - Conclusion
- FAQ
Creating visually appealing plots is crucial for data visualization, and Seaborn is a powerful library in Python that helps you achieve just that. One common requirement is adjusting the font size in your plots to enhance readability or to fit a specific presentation style.
In this tutorial, we will explore various methods to change the font size in Seaborn plots. Whether you want to change the font size for titles, labels, or annotations, we’ve got you covered with simple, effective solutions. Let’s dive in and learn how to make your Seaborn plots more engaging and informative!
Method 1: Using the fontsize Parameter
One of the simplest ways to change the font size in a Seaborn plot is by using the fontsize parameter within specific plotting functions. This allows you to set the font size directly for elements like titles, axis labels, and legends.
Here’s an example that demonstrates this method:
import seaborn as sns
import matplotlib.pyplot as plt

# Load an example dataset
tips = sns.load_dataset("tips")

# Create a bar plot
sns.barplot(x="day", y="total_bill", data=tips)

# Set the title and labels with font size
plt.title("Total Bill by Day", fontsize=20)
plt.xlabel("Day of the Week", fontsize=15)
plt.ylabel("Total Bill ($)", fontsize=15)

plt.show()
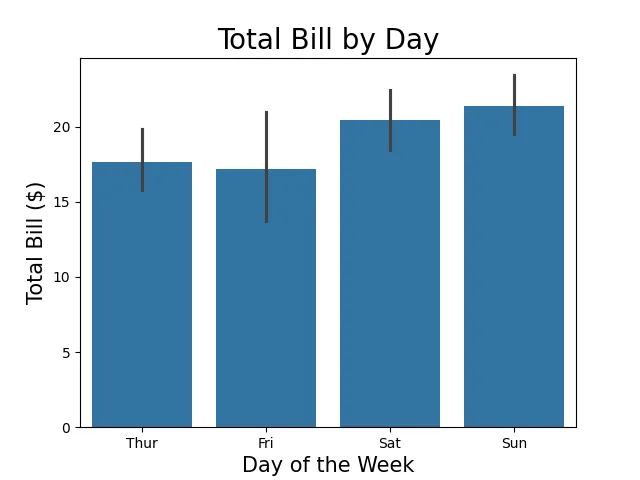
In this code snippet, we load the tips dataset and create a bar plot. The plt.title(), plt.xlabel(), and plt.ylabel() functions are used to set the title and the axis labels, respectively. Each of these functions includes a fontsize parameter that specifies the desired font size. This method is straightforward and effective for quick adjustments.
Method 2: Using set_context()
Another powerful method for changing font sizes across all elements in a Seaborn plot is by using the set_context() function. This function allows you to set the context for your plots, which influences the scaling of the font sizes for various plot elements. You can choose from predefined contexts like notebook, paper, talk, and poster.
Here’s how you can use set_context():
import seaborn as sns
import matplotlib.pyplot as plt

# Set the context to 'talk'
sns.set_context("talk")

# Load an example dataset
tips = sns.load_dataset("tips")

# Create a scatter plot
sns.scatterplot(x="total_bill", y="tip", data=tips)

# Set the title and labels
plt.title("Scatter Plot of Total Bill vs Tip")
plt.xlabel("Total Bill ($)")
plt.ylabel("Tip ($)")

plt.show()
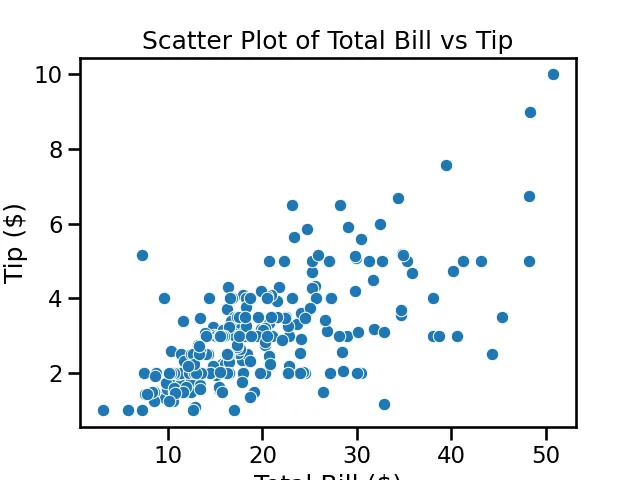
By calling sns.set_context("talk"), we scale the font sizes for the plot to be more suitable for a presentation setting. This method is especially useful when you want to maintain consistency in font sizes across multiple plots without manually adjusting each element.
Method 3: Customizing Font Size with rcParams
For users who want even more control over font sizes and styles across all plots, the rcParams dictionary from Matplotlib can be utilized. This method allows you to set global font size settings that will apply to all future plots.
Here’s how you can do it:
import seaborn as sns
import matplotlib.pyplot as plt

# Set global font size using rcParams
plt.rcParams['font.size'] = 14

# Load an example dataset
tips = sns.load_dataset("tips")

# Create a line plot
sns.lineplot(x="size", y="total_bill", data=tips)

# Set the title and labels
plt.title("Total Bill by Party Size")
plt.xlabel("Party Size")
plt.ylabel("Total Bill ($)")

plt.show()
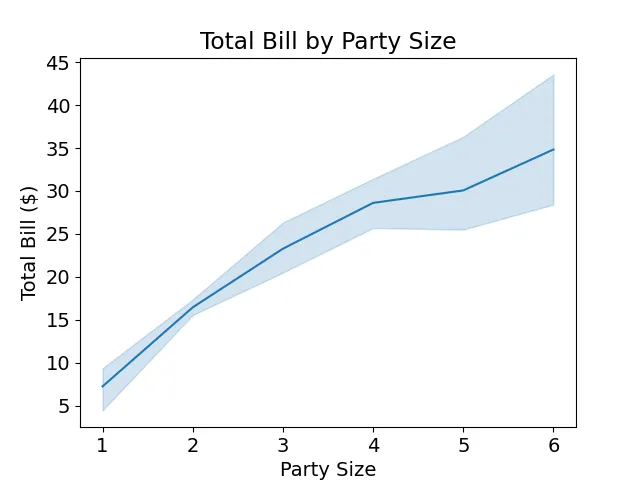
In this example, we adjust the global font size by modifying plt.rcParams['font.size']. This change affects all text elements in the plot, including titles, labels, and ticks. This method is particularly helpful when working on multiple plots and you want a uniform appearance.
Conclusion
Changing font sizes in Seaborn plots is a straightforward process that can significantly enhance the readability and overall aesthetics of your visualizations. Whether you opt for the fontsize parameter, utilize set_context(), or adjust global settings with rcParams, each method offers unique advantages. By implementing these techniques, you can create plots that not only convey information effectively but also look professional. So, go ahead and experiment with these options to find the best fit for your data visualization needs!
FAQ
-
How can I change the font size of only the title in a Seaborn plot?
You can change the font size of the title by using thefontsizeparameter in theplt.title()function. -
Is it possible to set different font sizes for x and y labels in Seaborn?
Yes, you can set different font sizes for x and y labels by using thefontsizeparameter in bothplt.xlabel()andplt.ylabel()functions separately. -
What is the difference between
set_context()andrcParams?
set_context()allows you to easily adjust font sizes for specific contexts, whilercParamsprovides a way to set global font sizes that apply to all plots. -
Can I use custom fonts in Seaborn plots?
Yes, you can use custom fonts by adding the font to Matplotlib’s font manager and then specifying it inrcParams. -
How do I reset font sizes to default in Seaborn?
You can reset font sizes to default by callingplt.rcdefaults()which restores the default settings for Matplotlib.

Manav is a IT Professional who has a lot of experience as a core developer in many live projects. He is an avid learner who enjoys learning new things and sharing his findings whenever possible.
LinkedIn