scale_fill_continuous in R
- What is scale_fill_continuous()?
- Basic Usage of scale_fill_continuous()
- Customizing Color Scales
- Using scale_fill_gradient() for Advanced Control
- Conclusion
- FAQ
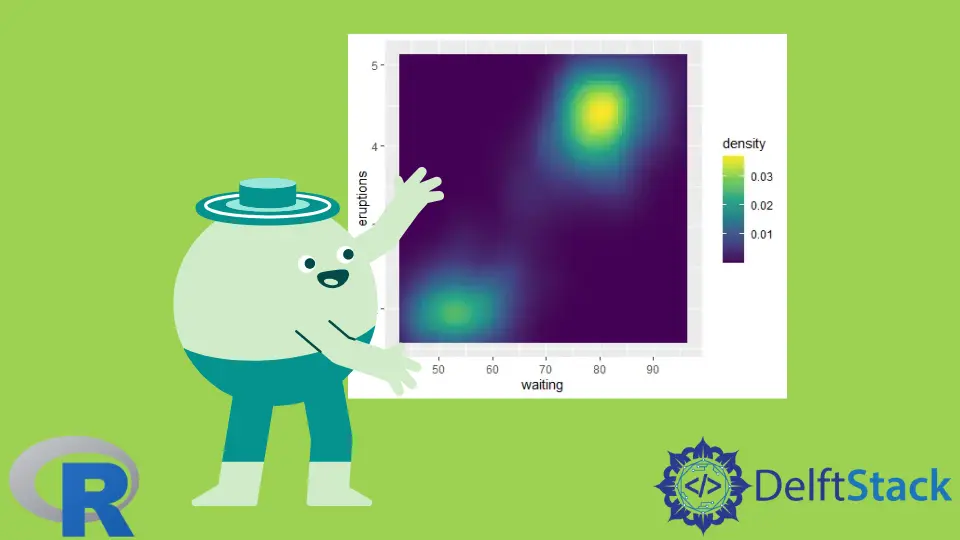
When working with data visualization in R, one of the most powerful functions at your disposal is scale_fill_continuous(). This function is part of the ggplot2 package, which is widely used for creating stunning graphics. By utilizing scale_fill_continuous(), you can effectively control the color scales of your continuous data, enhancing the visual appeal and clarity of your plots.
In this tutorial, we will dive deep into the functionality of scale_fill_continuous(), offering practical examples and insights to help you leverage this method in your data visualization projects. Whether you are a beginner or an experienced R user, this guide will equip you with the knowledge to create visually compelling graphics.
What is scale_fill_continuous()?
The scale_fill_continuous() function is designed to manage the color aesthetics of continuous variables in your plots. It allows you to customize the colors that represent different values in your dataset, making it easier for viewers to interpret the information conveyed through the visual representation. This function is particularly useful when dealing with heatmaps, choropleth maps, or any other type of plot where color intensity is essential in depicting data variations.
Basic Usage of scale_fill_continuous()
To illustrate how to use scale_fill_continuous(), let’s start with a simple example. First, ensure that you have the ggplot2 package installed and loaded in your R environment. You can do this with the following commands:
install.packages("ggplot2")
library(ggplot2)
Now, let’s create a basic scatter plot with a continuous fill scale. We will use the built-in mtcars dataset for this example.
ggplot(mtcars, aes(x = wt, y = mpg, fill = hp)) +
  geom_point(size = 4, shape = 21) +
  scale_fill_continuous(low = "blue", high = "red")
Output:
A scatter plot where the weight of the cars is on the x-axis, miles per gallon on the y-axis, and horsepower represented by a gradient from blue to red.
In this example, we are mapping the hp (horsepower) variable to the fill aesthetic of the points in the scatter plot. The scale_fill_continuous() function is then used to specify a color gradient, transitioning from blue for lower horsepower values to red for higher values. This visual cue allows viewers to quickly discern the relationship between horsepower and other variables in the dataset.
Customizing Color Scales
One of the great features of scale_fill_continuous() is its flexibility in customizing color scales. You can further enhance your plots by adding more parameters to control the aesthetics. For instance, you can modify the breaks and labels to make the plot more informative.
ggplot(mtcars, aes(x = wt, y = mpg, fill = hp)) +
  geom_point(size = 4, shape = 21) +
  scale_fill_continuous(low = "green", high = "orange",
                        breaks = seq(100, 300, by = 50),
                        labels = seq(100, 300, by = 50))
Output:
A scatter plot where the fill color varies from green to orange based on horsepower, with specified breaks and labels.
In this code, we have changed the color scale to range from green to orange. Additionally, we specified the breaks at every 50 horsepower units, and these values are labeled accordingly on the scale. This customization not only enhances the aesthetic appeal but also aids in the interpretability of the data.
Using scale_fill_gradient() for Advanced Control
For even more control over your color scales, you can use the scale_fill_gradient() function, which is a more specialized version of scale_fill_continuous(). It allows you to define specific colors for low and high values while giving you the option to add a midpoint color.
ggplot(mtcars, aes(x = wt, y = mpg, fill = hp)) +
  geom_point(size = 4, shape = 21) +
  scale_fill_gradient(low = "purple", mid = "yellow", high = "red",
                      midpoint = 150)
Output:
A scatter plot with a fill gradient transitioning from purple to yellow to red, centered around 150 horsepower.
In this example, we have introduced a midpoint color (yellow) that emphasizes the value of 150 horsepower. This is particularly useful when you want to highlight a specific range of values within your dataset. The visual representation becomes clearer, helping your audience to focus on the critical aspects of your data.
Conclusion
In summary, mastering the scale_fill_continuous() function in R is essential for creating impactful visualizations. By customizing color scales, you can significantly enhance the interpretability of your plots. Whether you are working with scatter plots, heatmaps, or any other type of continuous data visualization, the techniques discussed in this tutorial will help you convey your data’s story more effectively. Remember, the right color choices can make all the difference in how your audience perceives your data.
FAQ
-
What is the purpose of scale_fill_continuous() in R?
It is used to control the color scales for continuous variables in data visualizations. -
Can scale_fill_continuous() be used with discrete data?
No, it is specifically designed for continuous data. For discrete data, use scale_fill_discrete().
-
How do I install the ggplot2 package?
You can install it using the command install.packages(“ggplot2”) in your R console. -
What are the differences between scale_fill_gradient() and scale_fill_continuous()?
scale_fill_gradient() allows for more specific control over color transitions, including midpoints, while scale_fill_continuous() is more general. -
Can I customize the breaks and labels in scale_fill_continuous()?
Yes, you can customize breaks and labels to enhance the interpretability of your plots.

Sheeraz is a Doctorate fellow in Computer Science at Northwestern Polytechnical University, Xian, China. He has 7 years of Software Development experience in AI, Web, Database, and Desktop technologies. He writes tutorials in Java, PHP, Python, GoLang, R, etc., to help beginners learn the field of Computer Science.
LinkedIn Facebook