How to Create a 3D Surface Plot From (x,y,z) Coordinates
-
the
interp()Function of theakimaPackage in R -
the
persp3d()Function of therglPackage in R - Demonstration of the Functions
Base R and several packages provide functions to plot a 3-dimensional surface over the horizontal plane. Most of them need a z value for every combination of x and y values as input.
In other words, they need an x-y grid and z values for each point on the grid.
When we have a data frame or matrix of (x,y,z) values (coordinates), we can plot the points, but not the surface.
We need to estimate z values for all combinations of x and y values using the given data and an appropriate interpolation function to plot the surface.
This article will show how to use the akima package to estimate the z values for a grid of x-y values. We will then plot the surface using the rgl package.
the interp() Function of the akima Package in R
The akima package provides functions for interpolation of bivariate data.
The interp() function takes the three vectors x, y and z and returns a 40-by-40 grid of x-y values with a corresponding z value.
By default, a linear interpolation is produced.
the persp3d() Function of the rgl Package in R
The rgl package creates 3D interactive graphics. We can zoom and rotate the plot using the mouse.
We will use the persp3d() function to plot the surface and the points3d() function to plot the original data.
In order to view the plots in R we need to set a particular option: options(rgl.printRglwidget = TRUE).
Demonstration of the Functions
We will go through the following steps.
-
Install the required packages if they are not already available.
-
Load the required packages.
-
Create the sample data frame.
-
Create the list of
zvalues corresponding to a grid ofx-yvalues usinginterp(). -
Plot the surface using
persp3d(). -
Add the points using
points3d().
Example Code:
# INSTALL AND LOAD THE PACKAGES.
# Uncomment and run the concerned line to install the package.
#install.packages("akima")
library(akima)
#install.packages("rgl")
library(rgl)
# CREATE THE SAMPLE DATA.
set.seed(1)
x=rnorm(50)
set.seed(2)
y=rnorm(50)
z=c(rep(5,5),rep(-10,5), rep(3,15), rep(20,5), seq(5,15, length.out=10), rep(0,5), rep(3,5))
XYZ=data.frame(x,y,z)
# INTERPOLATE THE Z VALUES.
a_mat=interp(XYZ$x, XYZ$y, XYZ$z)
# PLOT THE SURFACE AND THE POINTS.
options(rgl.printRglwidget = TRUE)
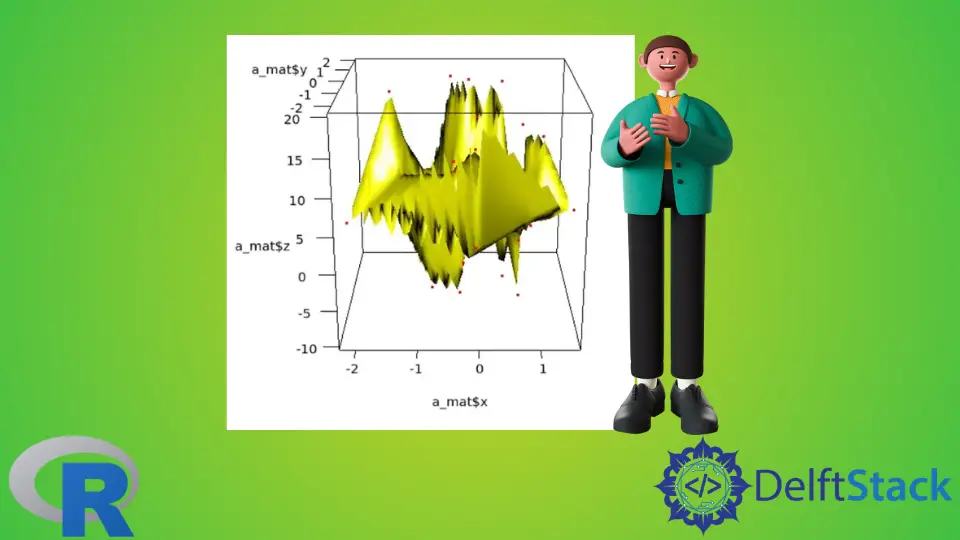
persp3d(a_mat$x, a_mat$y, a_mat$z, col="yellow")
points3d(x,y,z, col="red")
Output plot:
rgl produces an interactive 3D plot.


Jesse is passionate about data analysis and visualization. He uses the R statistical programming language for all aspects of his work.