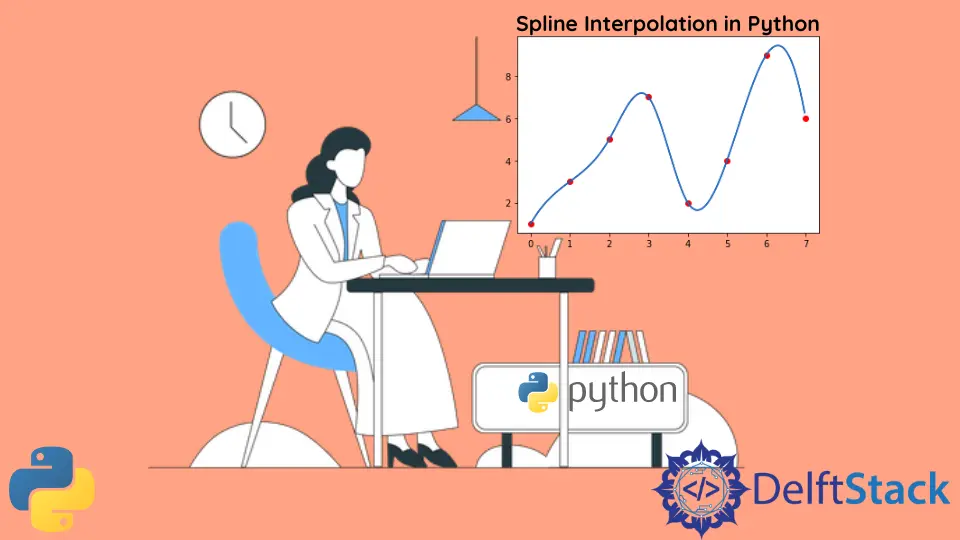
Spline Interpolation in Python
- Understanding Spline Interpolation
- Using SciPy for Spline Interpolation
- B-spline Interpolation
- Conclusion
- FAQ

Spline interpolation is a powerful mathematical technique used to create smooth curves through a set of data points. In the world of data science and numerical analysis, spline interpolation plays a crucial role in approximating functions and filling in gaps in datasets.
This tutorial will guide you through the basics of spline interpolation in Python, showcasing how to implement it effectively using libraries like SciPy. Whether you’re a seasoned programmer or just getting started, you’ll find that spline interpolation can significantly enhance your data analysis capabilities. Let’s dive into the world of splines and see how they can be utilized in Python.
Understanding Spline Interpolation
Before jumping into the code, it’s essential to understand what spline interpolation is. Essentially, a spline is a piecewise polynomial function that can interpolate a given set of points smoothly. Unlike linear interpolation, which connects points with straight lines, spline interpolation uses polynomial segments to create a smooth curve that passes through all the points. This method is particularly useful when dealing with complex datasets where a simple linear approach would not suffice.
Using SciPy for Spline Interpolation
One of the most popular libraries for numerical computations in Python is SciPy. It provides a module specifically for interpolation, which includes various methods, including spline interpolation. Below, we will explore how to use the scipy.interpolate library to perform spline interpolation.
Example of Cubic Spline Interpolation
Cubic spline interpolation is one of the most commonly used forms of spline interpolation. It uses cubic polynomials to create a smooth curve through the data points. The following code demonstrates how to implement cubic spline interpolation in Python.
import numpy as np
import matplotlib.pyplot as plt
from scipy.interpolate import CubicSpline

# Sample data points
x = np.array([0, 1, 2, 3, 4, 5])
y = np.array([0, 1, 0, 1, 0, 1])

# Creating a cubic spline interpolation function
cs = CubicSpline(x, y)

# Generating new x values for interpolation
x_new = np.linspace(0, 5, 100)
y_new = cs(x_new)

# Plotting the results
plt.figure(figsize=(8, 5))
plt.plot(x, y, 'o', label='Data Points')
plt.plot(x_new, y_new, label='Cubic Spline Interpolation')
plt.title('Cubic Spline Interpolation Example')
plt.xlabel('X-axis')
plt.ylabel('Y-axis')
plt.legend()
plt.grid()
plt.show()
Output:
A smooth curve passing through the data points will be displayed.
In this example, we first import the necessary libraries: NumPy for numerical operations, Matplotlib for plotting, and the CubicSpline class from SciPy. We define sample data points and create a cubic spline interpolation function using these points. The linspace function generates new x-values for which we want to find interpolated y-values. Finally, we plot both the original data points and the cubic spline interpolation.
The result is a smooth curve that accurately represents the underlying trend of the data, demonstrating the effectiveness of cubic spline interpolation. This method is particularly useful in applications such as computer graphics, data fitting, and scientific computing, where smooth transitions are essential.
B-spline Interpolation
B-splines, or Basis splines, are another type of spline that provides greater flexibility and control over the shape of the curve. They are defined by a set of control points and a degree, allowing for more complex shapes while maintaining smoothness. Here’s how you can implement B-spline interpolation in Python.
import numpy as np
import matplotlib.pyplot as plt
from scipy.interpolate import BSpline

# Sample data points
x = np.array([0, 1, 2, 3, 4])
y = np.array([0, 1, 0, 1, 0])

# Define the knots and coefficients for B-spline
degree = 3
knots = np.concatenate(([0]*degree, np.arange(1, 5), [4]*degree))
coefficients = [0, 1, 0, 1, 0]

# Create B-spline representation
bspline = BSpline(knots, coefficients, degree)

# Generating new x values for interpolation
x_new = np.linspace(0, 4, 100)
y_new = bspline(x_new)

# Plotting the results
plt.figure(figsize=(8, 5))
plt.plot(x, y, 'o', label='Data Points')
plt.plot(x_new, y_new, label='B-Spline Interpolation')
plt.title('B-Spline Interpolation Example')
plt.xlabel('X-axis')
plt.ylabel('Y-axis')
plt.legend()
plt.grid()
plt.show()
In this example, we first define our sample data points. The B-spline is constructed using a specified degree and a set of knots. The BSpline class from SciPy allows us to create a B-spline representation based on these parameters. Similar to the cubic spline example, we generate new x-values and compute the corresponding y-values using the B-spline function. Finally, we plot the data points alongside the B-spline interpolation.
B-splines are particularly advantageous for applications requiring high degrees of control over the shape of the curve, such as in computer-aided design (CAD) and animation. They offer a robust way to model complex shapes while ensuring smoothness and continuity.
Conclusion
Spline interpolation is an invaluable tool in Python for data analysis and visualization. Whether you choose cubic splines or B-splines, both methods provide a means to create smooth curves that accurately represent your data. By leveraging libraries like SciPy, you can implement these techniques with ease, enhancing your data processing capabilities. As you continue to explore the vast world of data science, mastering spline interpolation will undoubtedly be a beneficial skill.
FAQ
-
What is spline interpolation?
Spline interpolation is a method of constructing a smooth curve that passes through a set of given points using piecewise polynomial functions. -
Why use cubic splines over linear interpolation?
Cubic splines provide a smoother curve compared to linear interpolation, which results in a more accurate representation of the underlying data trends. -
What are B-splines?
B-splines, or Basis splines, are a type of spline defined by control points and a degree, allowing for greater flexibility in shaping the curve. -
Can spline interpolation be used for data fitting?
Yes, spline interpolation is commonly used for data fitting, as it can effectively model complex relationships between variables. -
Do I need any special libraries to perform spline interpolation in Python?
Yes, the SciPy library provides robust tools for spline interpolation, including theCubicSplineandBSplineclasses.
Rana is a computer science graduate passionate about helping people to build and diagnose scalable web application problems and problems developers face across the full-stack.
LinkedIn