Memory Profiler in Python
- Understanding Memory Profiling in Python
-
Using the
@profileDecorator - Profiling Memory with the Command Line
-
Visualizing Memory Usage with
memory_profiler - Conclusion
- FAQ
In the world of software development, understanding how your code consumes memory is crucial. Memory leaks and high memory usage can lead to performance degradation and application crashes. This is where memory profilers come into play, offering insights into memory consumption patterns of your Python code.
In this tutorial, we will explore how to use memory profilers in Python to monitor memory usage effectively. By the end, you’ll be equipped with the knowledge to optimize your code, ensuring it runs smoothly and efficiently. Let’s dive into the various methods available for profiling memory in Python!
Understanding Memory Profiling in Python
Memory profiling is the process of measuring the amount of memory used by a program during execution. It helps developers identify memory usage patterns, pinpoint memory leaks, and optimize code performance. When it comes to Python, there are several tools available, but one of the most popular is the memory_profiler library. This library provides a simple way to monitor memory usage line by line.
To get started, you need to install the memory_profiler package. You can do this using pip:
pip install memory_profiler
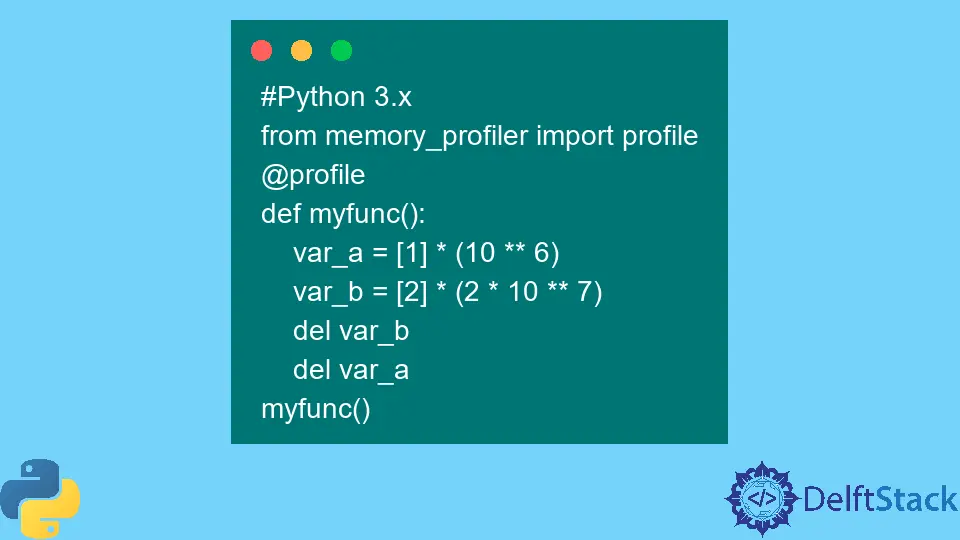
Once installed, you can use the @profile decorator to annotate the functions you want to profile. Let’s look at an example to see how this works.
Using the @profile Decorator
The @profile decorator allows you to mark specific functions in your code for memory profiling. This approach is straightforward and provides detailed memory usage statistics for each line of the function.
Here’s a simple example to illustrate how to use the @profile decorator:
from memory_profiler import profile

@profile
def my_function():
    a = [i for i in range(10000)]
    b = [i ** 2 for i in a]
    del b
    return a

if __name__ == "__main__":
    my_function()
Output:
Line #    Mem usage    Increment  Occurrences   Line Contents
==============================================================
     1     12.3 MiB     12.3 MiB           1   @profile
     2                                         def my_function():
     3     12.3 MiB      0.0 MiB           1       a = [i for i in range(10000)]
     4     12.5 MiB      0.2 MiB           1       b = [i ** 2 for i in a]
     5     12.5 MiB      0.0 MiB           1       del b
     6     12.3 MiB     -0.2 MiB           1       return a
In this example, my_function creates a list of numbers and then computes their squares. The output shows memory usage before and after each line of code. You can see how much memory was consumed and how it changed after each operation. This allows you to identify which parts of your code are using the most memory and where optimizations can be made.
Profiling Memory with the Command Line
Another effective way to profile memory in Python is by using the command line. The memory_profiler library provides a command-line tool that allows you to run your Python scripts while monitoring their memory usage. This is particularly useful for profiling entire scripts without modifying the code.
To use this method, simply run your script with the -m memory_profiler option. Here’s how you can do it:
- Create a Python script named
script.py:
def my_function():
    a = [i for i in range(100000)]
    b = [i ** 2 for i in a]
    del b
    return a

if __name__ == "__main__":
    my_function()
- Run the script with memory profiling:
python -m memory_profiler script.py
Output:
Line #    Mem usage    Increment  Occurrences   Line Contents
==============================================================
     1     12.4 MiB     12.4 MiB           1   def my_function():
     2     12.4 MiB      0.0 MiB           1       a = [i for i in range(100000)]
     3     14.0 MiB      1.6 MiB           1       b = [i ** 2 for i in a]
     4     14.0 MiB      0.0 MiB           1       del b
     5     12.4 MiB     -1.6 MiB           1       return a
This command will execute your script and display memory usage statistics in the terminal. You can see how memory consumption changes as the function progresses. This method is particularly useful for quickly profiling larger scripts without modifying the codebase.
Visualizing Memory Usage with memory_profiler
For those who prefer a visual representation of memory usage, memory_profiler offers a way to visualize memory consumption through graphs. This can help you better understand memory usage patterns over time. To visualize memory usage, you can use the mprof command that comes with the memory_profiler package.
Here’s how to visualize memory usage:
-
First, ensure you have your script ready. Let’s use the previous example.
-
Run the following command to start monitoring:
mprof run script.py
- After the script execution, generate a plot:
mprof plot
Output:
Generating plot...
This will create a visual graph showing memory usage over time. You can analyze the graph to identify peaks and troughs in memory consumption, helping you pinpoint areas for optimization.
Conclusion
Memory profiling is an essential practice for Python developers aiming to optimize their code and ensure efficient memory usage. By using tools like memory_profiler, you can easily monitor memory consumption and identify potential issues. Whether you prefer using decorators, command-line tools, or visual representations, memory profiling can significantly enhance your understanding of how your code operates in terms of memory. Start profiling your Python applications today and make your code more efficient!
FAQ
- What is memory profiling in Python?
Memory profiling in Python is the process of measuring the memory consumption of code to identify usage patterns and optimize performance.
-
How do I install the memory_profiler library?
You can install the memory_profiler library using pip with the commandpip install memory_profiler. -
Can I use memory_profiler without modifying my code?
Yes, you can use the command line to profile your scripts without modifying the code by runningpython -m memory_profiler script.py. -
What is the benefit of visualizing memory usage?
Visualizing memory usage helps you quickly identify memory consumption patterns, making it easier to pinpoint areas for optimization. -
Is memory profiling important for all Python applications?
Yes, memory profiling is crucial for all Python applications, especially those that handle large datasets or run in resource-constrained environments.

I am Fariba Laiq from Pakistan. An android app developer, technical content writer, and coding instructor. Writing has always been one of my passions. I love to learn, implement and convey my knowledge to others.
LinkedIn