How to Calculate and Display a Convex Hull in Python
- Understanding the Convex Hull
- Method 1: Using Scipy’s Convex Hull Function
- Method 2: Using the Quickhull Algorithm
- Conclusion
- FAQ
Calculating and displaying a convex hull is a fascinating and useful task in computational geometry. Whether you’re working on data visualization, game development, or geographic information systems, understanding how to compute a convex hull can enhance your projects.
In this tutorial, we will walk through the process of calculating and displaying a convex hull using Python. We will leverage libraries like NumPy and Matplotlib to perform these tasks efficiently. By the end, you’ll not only know how to compute a convex hull but also how to visualize it, making your data analysis much more insightful and engaging.
Understanding the Convex Hull
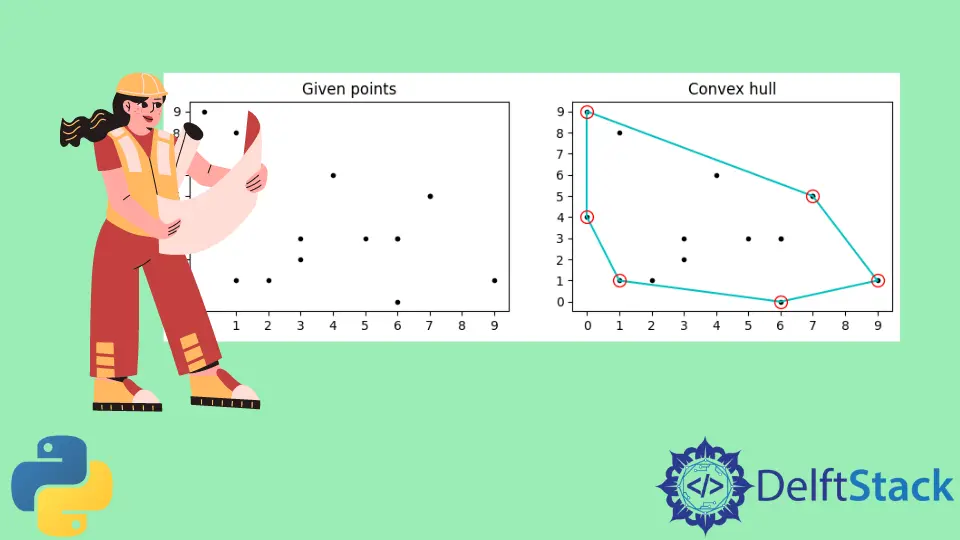
Before diving into the code, let’s clarify what a convex hull is. Imagine you have a set of points scattered in a 2D space. The convex hull is the smallest convex shape that can enclose all these points. It’s akin to stretching a rubber band around the outermost points. This concept is widely used in various fields, including computer graphics, pattern recognition, and robotics.
Method 1: Using Scipy’s Convex Hull Function
One of the most straightforward ways to calculate a convex hull in Python is by using the ConvexHull function from the SciPy library. This method is efficient and easy to implement, making it a popular choice among developers.
First, ensure you have the necessary libraries installed. You can do this via pip:
pip install numpy matplotlib scipy
Now, let’s see the code to calculate and display the convex hull.
import numpy as np
import matplotlib.pyplot as plt
from scipy.spatial import ConvexHull

points = np.random.rand(30, 2)
hull = ConvexHull(points)

plt.plot(points[:, 0], points[:, 1], 'o')
for simplex in hull.simplices:
    plt.plot(points[simplex, 0], points[simplex, 1], 'k-')
plt.show()
In this code, we first import the required libraries. We generate a set of random points using NumPy and then compute the convex hull using the ConvexHull function from SciPy. The hull.simplices provides the indices of the points that make up the edges of the convex hull, which we use to plot the hull. Finally, we visualize the points and the convex hull using Matplotlib.
This method is particularly useful when dealing with a large dataset, as SciPy’s implementation is optimized for performance. The visualization helps in understanding how the convex hull encloses the points, providing a clear representation of the concept.
Method 2: Using the Quickhull Algorithm
If you’re interested in implementing the convex hull calculation from scratch, the Quickhull algorithm is a great choice. It’s a recursive algorithm that works similarly to the QuickSort algorithm, making it efficient and effective.
Here’s how you can implement the Quickhull algorithm in Python:
def quickhull(points, p1, p2):
    if len(points) == 0:
        return []

    # Finding the point farthest from the line p1-p2
    farthest_point = None
    max_distance = 0
    for point in points:
        distance = np.cross(p2 - p1, p1 - point) / np.linalg.norm(p2 - p1)
        if distance > max_distance:
            max_distance = distance
            farthest_point = point

    left_set = [p for p in points if np.cross(farthest_point - p1, p1 - p) > 0]
    right_set = [p for p in points if np.cross(farthest_point - p2, p2 - p) > 0]

    return (quickhull(left_set, p1, farthest_point) +
            [farthest_point] +
            quickhull(right_set, farthest_point, p2))

points = np.random.rand(30, 2)
hull_points = quickhull(points, points[0], points[1])

plt.plot(points[:, 0], points[:, 1], 'o')
hull_points = np.array(hull_points)
plt.plot(hull_points[:, 0], hull_points[:, 1], 'k-')
plt.show()
In this implementation, the quickhull function recursively finds the points that form the convex hull. The function takes a set of points and two endpoints (p1 and p2) of the line segment. It identifies the point farthest from this segment and divides the remaining points into two subsets, recursively processing each subset. Finally, we visualize the resulting hull along with the original points.
Implementing Quickhull from scratch gives you a deeper understanding of the algorithm and computational geometry. While it may not be as efficient as SciPy’s built-in function for very large datasets, it’s a great learning exercise.
Conclusion
Calculating and displaying a convex hull in Python is a valuable skill that can enhance your data visualization and analysis capabilities. Whether you choose to use the built-in functionality from libraries like SciPy or implement your own version using the Quickhull algorithm, understanding the concepts behind convex hulls will empower you in various applications. With the provided examples, you can easily integrate convex hull calculations into your projects, making your data presentations more insightful and visually appealing.
FAQ
-
What is a convex hull?
A convex hull is the smallest convex shape that can enclose a set of points in a plane. -
How does the Quickhull algorithm work?
The Quickhull algorithm recursively finds the farthest points from a line segment and divides the set of points into subsets until the convex hull is formed. -
Can I calculate a convex hull in 3D?
Yes, both SciPy and other libraries can compute convex hulls in three dimensions. -
What are some applications of convex hulls?
Convex hulls are used in computer graphics, pattern recognition, and geographic information systems. -
Is there a performance difference between SciPy’s ConvexHull and Quickhull?
Yes, SciPy’s implementation is optimized for performance and is generally faster for large datasets compared to a custom Quickhull implementation.
