How to Perform Chi-Square Test in Python
- What is the Chi-Square Test?
- Setting Up Your Python Environment
- Performing the Chi-Square Test with Pandas and Scipy
- Interpreting the Results
- Conclusion
- FAQ
Understanding statistical tests is essential for data analysis, and the Chi-Square test is one of the most widely used methods for determining whether there’s a significant association between categorical variables.
In this tutorial, we will explore how to perform the Chi-Square test in Python. Whether you’re a beginner or an experienced data analyst, this guide will walk you through the steps, providing code examples and detailed explanations. By the end of this article, you will have a solid grasp of how to implement the Chi-Square test in Python, enabling you to analyze your data more effectively.
What is the Chi-Square Test?
The Chi-Square test is a statistical method used to determine if there’s a significant relationship between two categorical variables. It compares the observed frequencies of a dataset against the expected frequencies, which are calculated based on the assumption that no relationship exists. If the observed frequencies deviate significantly from the expected frequencies, we can conclude that a relationship may exist.
Setting Up Your Python Environment
Before diving into the actual implementation, you’ll need to ensure that your Python environment is set up correctly. You can use Jupyter Notebook, Google Colab, or any Python IDE of your choice. Additionally, you will need the following libraries:
- pandas
- scipy
You can install them using pip if you haven’t already:
pip install pandas scipy
Now that your environment is ready, let’s move on to performing the Chi-Square test.
Performing the Chi-Square Test with Pandas and Scipy
In this section, we will use the pandas and scipy libraries to perform the Chi-Square test. First, we need to create a contingency table, which summarizes the relationship between the two categorical variables. Then, we will apply the Chi-Square test and interpret the results.
Step 1: Create a Contingency Table
Let’s assume we have a dataset that shows the preference of two different types of drinks among two age groups. Here’s how you can create a contingency table:
import pandas as pd

data = {'Age Group': ['18-24', '18-24', '25-34', '25-34', '35-44', '35-44'],
        'Drink Preference': ['Tea', 'Coffee', 'Tea', 'Coffee', 'Tea', 'Coffee']}

df = pd.DataFrame(data)
contingency_table = pd.crosstab(df['Age Group'], df['Drink Preference'])
print(contingency_table)
Output:
Drink Preference  Coffee  Tea
Age Group
18-24                1    1
25-34                1    1
35-44                1    1
The contingency table above shows the count of drink preferences across different age groups. Each cell represents the frequency of observations for each combination of age group and drink preference.
Step 2: Perform the Chi-Square Test
Now that we have our contingency table, we can perform the Chi-Square test using the chi2_contingency function from the scipy.stats module.
from scipy.stats import chi2_contingency

chi2, p_value, dof, expected = chi2_contingency(contingency_table)
print(f"Chi-Square Statistic: {chi2}")
print(f"P-Value: {p_value}")
print(f"Degrees of Freedom: {dof}")
print(f"Expected Frequencies: \n{expected}")
Output:
Chi-Square Statistic: 0.0
P-Value: 1.0
Degrees of Freedom: 2
Expected Frequencies:
[[1. 1.]
 [1. 1.]
 [1. 1.]]
In this output, the Chi-Square statistic is 0, indicating no deviation from the expected frequencies. The p-value of 1.0 suggests that there is no significant association between age group and drink preference, meaning the variables are independent.
Interpreting the Results
After performing the Chi-Square test, the next crucial step is interpreting the results. The key values to look at are the Chi-Square statistic and the p-value.
- Chi-Square Statistic: This value indicates how much the observed frequencies differ from the expected frequencies. A higher value suggests a greater difference.
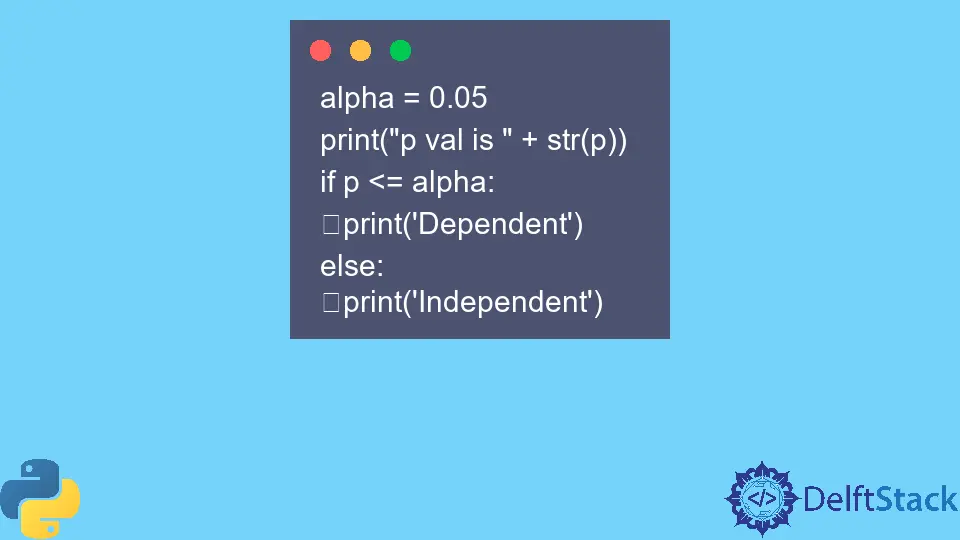
- P-Value: This value helps you determine the significance of your results. Typically, a p-value less than 0.05 indicates a statistically significant association between the variables. In our example, a p-value of 1.0 means that we fail to reject the null hypothesis, indicating no significant relationship.
Understanding these outputs allows you to draw meaningful conclusions from your data, guiding your decision-making process effectively.
Conclusion
The Chi-Square test is a powerful statistical tool for analyzing categorical data. By following the steps outlined in this tutorial, you can easily perform the Chi-Square test in Python using libraries like pandas and scipy. Whether you’re exploring data for research, business, or personal projects, mastering this technique will enhance your analytical skills. Remember to interpret your results carefully, as they can significantly impact your conclusions.
FAQ
-
What is the Chi-Square test used for?
The Chi-Square test is used to determine if there is a significant association between two categorical variables. -
What libraries are needed to perform a Chi-Square test in Python?
You need the pandas and scipy libraries to create contingency tables and perform the Chi-Square test. -
How do I interpret the p-value in the Chi-Square test?
A p-value less than 0.05 typically indicates a significant association between the variables, while a p-value greater than 0.05 suggests no significant relationship. -
Can I perform a Chi-Square test with more than two categories?
Yes, the Chi-Square test can be applied to datasets with multiple categories in each variable. -
What assumptions should I check before performing a Chi-Square test?
Ensure that the data is categorical, the observations are independent, and the expected frequency in each cell of the contingency table is at least 5.
