How to Calculate the Probability of Normal Distribution using SciPy
- What is Normal Distribution?
- Calculating Probability Density Function (PDF)
- Calculating Cumulative Distribution Function (CDF)
- Finding Percentiles and Z-scores
- Conclusion
- FAQ
Understanding the normal distribution is fundamental in statistics, and calculating probabilities from it can seem daunting. However, with the right tools, such as SciPy, you can make this task straightforward and efficient.
In this article, we will explore how to calculate the probability of normal distribution using SciPy in Python. We will cover the concepts of cumulative distribution functions (CDF) and probability density functions (PDF), along with practical code examples to help you grasp these concepts easily. Whether you’re a beginner or looking to refresh your knowledge, this guide will provide you with the insights you need to work confidently with normal distributions in Python.
What is Normal Distribution?
Normal distribution, often referred to as Gaussian distribution, is a continuous probability distribution characterized by its bell-shaped curve. It is defined by two parameters: the mean (μ) and the standard deviation (σ). The mean indicates the center of the distribution, while the standard deviation measures the spread or dispersion of the data points around the mean.
In practical applications, the normal distribution is widely used in fields ranging from finance to natural and social sciences. Many phenomena, such as heights, test scores, and measurement errors, tend to follow a normal distribution. Understanding how to calculate probabilities from this distribution is crucial for data analysis and decision-making.
Calculating Probability Density Function (PDF)
The Probability Density Function (PDF) of a normal distribution describes the likelihood of a random variable falling within a particular range of values. In SciPy, we can easily calculate the PDF using the scipy.stats.norm module. Below is an example of how to calculate the PDF for a given mean and standard deviation.
import numpy as np
import matplotlib.pyplot as plt
from scipy.stats import norm

mean = 0
std_dev = 1
x = np.linspace(-5, 5, 100)
pdf = norm.pdf(x, mean, std_dev)

plt.plot(x, pdf, label='PDF', color='blue')
plt.title('Normal Distribution PDF')
plt.xlabel('X-axis')
plt.ylabel('Probability Density')
plt.legend()
plt.grid()
plt.show()
Output:
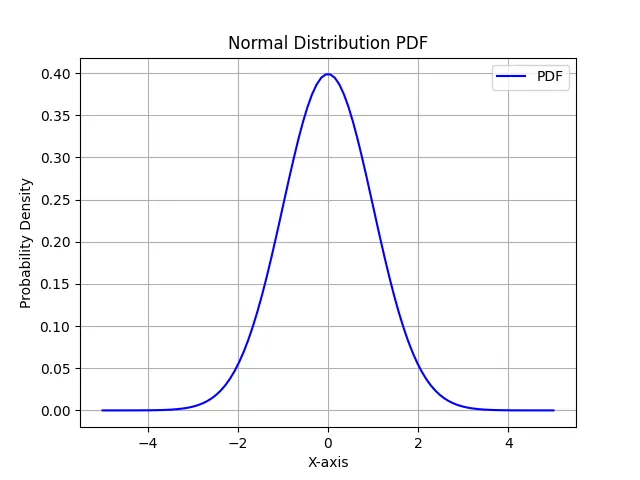
In this code, we import the necessary libraries, including NumPy for numerical operations and Matplotlib for plotting. We set the mean to 0 and the standard deviation to 1, which represent the standard normal distribution. The np.linspace function generates an array of 100 values ranging from -5 to 5. The norm.pdf function calculates the PDF for these values based on the specified mean and standard deviation. Finally, we plot the PDF using Matplotlib.
The resulting graph illustrates the bell-shaped curve, where the highest point corresponds to the mean. This curve represents the probability density of the random variable at different points along the x-axis.
Calculating Cumulative Distribution Function (CDF)
The Cumulative Distribution Function (CDF) provides the probability that a random variable will take a value less than or equal to a specific value. This function is also readily available in the SciPy library. Here’s how you can calculate the CDF for a normal distribution.
from scipy.stats import norm

mean = 0
std_dev = 1
value = 1.5
cdf_value = norm.cdf(value, mean, std_dev)

print(f'The CDF at x = {value} is {cdf_value:.4f}')
Output:
The CDF at x = 1.5 is 0.9332
In this example, we again use SciPy’s norm module. We define the mean and standard deviation for our normal distribution and choose a specific value, in this case, 1.5. The norm.cdf function computes the cumulative probability for this value. The output displays the CDF, indicating that approximately 93.32% of the data falls below 1.5 in a standard normal distribution.
Understanding the CDF is essential for various applications, such as hypothesis testing and confidence intervals. It allows you to determine the likelihood of a random variable being less than or equal to a certain threshold.
Finding Percentiles and Z-scores
Percentiles are another important aspect of normal distribution, indicating the value below which a given percentage of observations fall. SciPy makes it simple to find percentiles using the ppf (percent-point function) method. This method can also help in calculating Z-scores, which represent the number of standard deviations an element is from the mean.
from scipy.stats import norm

mean = 0
std_dev = 1
percentile = 0.95
z_score = norm.ppf(percentile, mean, std_dev)

print(f'The Z-score at the {percentile * 100}% percentile is {z_score:.4f}')
Output:
The Z-score at the 95.0% percentile is 1.6449
In this code snippet, we define the mean and standard deviation for the standard normal distribution. We specify the desired percentile, which is 0.95, indicating the 95th percentile. The norm.ppf function computes the Z-score corresponding to this percentile. The output reveals that a Z-score of approximately 1.6449 corresponds to the 95th percentile in a standard normal distribution.
Understanding Z-scores is crucial for interpreting data in terms of standard deviations from the mean. This concept is widely used in statistics, particularly in hypothesis testing and determining outliers.
Conclusion
Calculating probabilities for normal distributions using SciPy is a powerful skill for anyone working with data. By understanding the PDF, CDF, and percentiles, you can make informed decisions based on statistical analysis. Whether you’re analyzing data trends, conducting research, or performing quality control, mastering these techniques will enhance your ability to interpret and present data effectively. With the examples provided, you should feel more confident in applying these concepts in your projects.
FAQ
-
What is a normal distribution?
A normal distribution is a continuous probability distribution characterized by a bell-shaped curve, defined by its mean and standard deviation. -
How do I calculate the PDF in SciPy?
You can calculate the PDF in SciPy using thescipy.stats.norm.pdffunction, providing the value, mean, and standard deviation as parameters. -
What does the CDF represent?
The Cumulative Distribution Function (CDF) represents the probability that a random variable will take a value less than or equal to a specific value. -
How is the Z-score calculated?
The Z-score is calculated using the formula: (X - μ) / σ, where X is the value, μ is the mean, and σ is the standard deviation. -
Why is the normal distribution important in statistics?
The normal distribution is important because many statistical methods assume data is normally distributed, making it essential for hypothesis testing and confidence intervals.

Shiv is a self-driven and passionate Machine learning Learner who is innovative in application design, development, testing, and deployment and provides program requirements into sustainable advanced technical solutions through JavaScript, Python, and other programs for continuous improvement of AI technologies.
LinkedIn