Superscript in Python Matplotlib Plots
- Write Superscript in Matplotlib Plots Using the Dollar Sign
- Using Curly Brackets for Multiple Characters in Superscripts
- Adding Special Mathematical Symbols in Plots
-
Using
\mathregularfor Normal Font Superscripts - FAQ

This tutorial will discuss writing superscripts in plots using the dollar sign in Python.
Write Superscript in Matplotlib Plots Using the Dollar Sign
We use Matplotlib to plot graphs in Python. Sometimes, we need to add labels to the plot, which include subscripts or superscripts. The Matplotlib also provides a way to write subscripts or superscripts using the dollar sign. To make subscripts, you have to write the expression inside the dollar sign using the _ and ^ symbols. If you use the _ symbol, the superscript will be under the character. If you use the ^ symbol, the superscript will be over the character. For example, let’s create a plot using the Matplotlib and add superscripts using the dollar sign. See the code below.
import matplotlib.pyplot as plt

fig, ax = plt.subplots()
ax.set(title=r"$e^{-t}$", xlabel=r"$time_s$", ylabel=r"$m^2$")
plt.show()
Output:

As you can see in the plot, the -t is above the character e because we used the ^ symbol, and the s is below the string time because we used the _ symbol. If the subscript or superscript consists of more than one character, you have put the superscript inside the curly brackets {} otherwise; only the first character will be in the superscript or subscript.
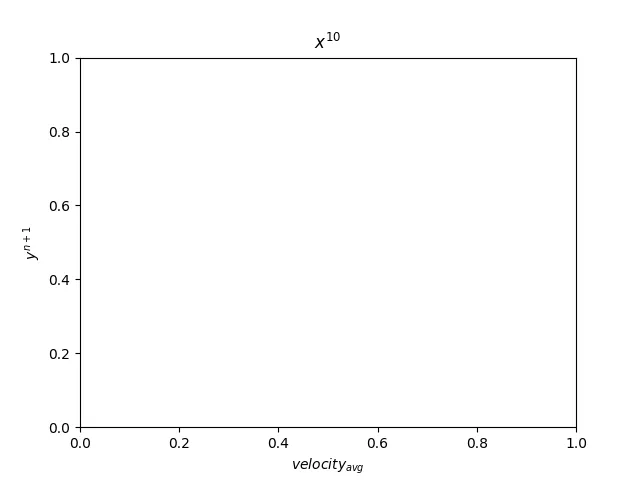
Using Curly Brackets for Multiple Characters in Superscripts
When using multiple characters for superscripts or subscripts, enclose them in curly brackets {}; otherwise, only the first character will be formatted as intended.
import matplotlib.pyplot as plt

fig, ax = plt.subplots()
ax.set(title=r"$x^{10}$", xlabel=r"$velocity_{avg}$", ylabel=r"$y^{n+1}$")
plt.show()
Adding Special Mathematical Symbols in Plots
If you want to put special symbols in the plot, like the alpha or pie symbol, you can use the pre-defined symbols in Matplotlib. To use the symbols, you have to write the symbol name along with a backslash. For example, let’s put some special symbols like pie and alpha in the above graph. See the code below.
import matplotlib.pyplot as plt

fig, ax = plt.subplots()
ax.set(title=r"$\alpha^{-t}$", xlabel=r"$\tau_s$", ylabel=r"$\pi^2$")
plt.show()
Output:

As you can see in the plot, there are alpha, pie, and tau symbols. Make sure to use the correct symbol name along with the backslash; otherwise, there will be an error. If you want the superscripted text to be in the same font as the rest of the text, use \mathregular. Check this link to find all the supported symbols and more information about the subscripts and superscripts.
Using \mathregular for Normal Font Superscripts
If you want the superscripted text to maintain a regular font instead of LaTeX-style formatting, use \mathregular{}. Unlike the default LaTeX-style math rendering, \mathregular{} ensures that the text adopts the same font style as the surrounding labels. This is particularly useful when mixing mathematical notation with standard text labels in Matplotlib.
For example, in the following code snippet, H^2 is rendered in a regular font rather than the default italicized mathematical style:
import matplotlib.pyplot as plt

fig, ax = plt.subplots()
ax.set(title=r"$\mathregular{H^2}$", xlabel=r"$\mathregular{t_0}$", ylabel=r"$\mathregular{d^{10}}$")
plt.show()
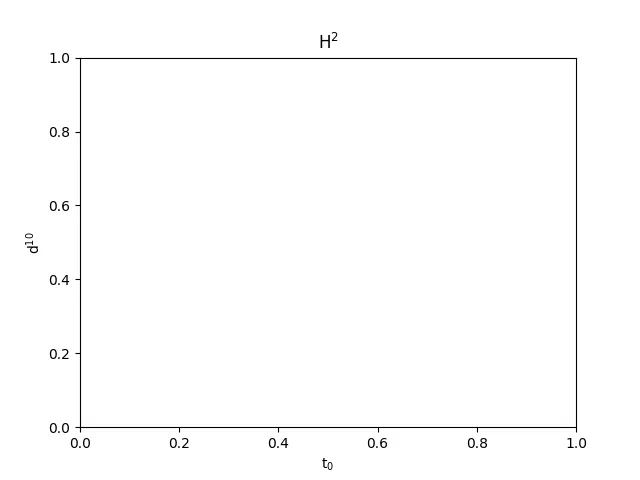
This ensures that superscripts and subscripts appear in a consistent style with other textual elements in the plot. Using \mathregular{} can help maintain a cleaner and more professional appearance, especially in scientific and technical presentations where uniform text formatting is preferred.
FAQ
-
How do I add multiple characters in a superscript in Matplotlib?
You need to enclose multiple characters in curly brackets{}.ax.set(title=r"$x^{10}$") -
How do I add a Greek letter as a superscript in Matplotlib?
Use the Greek letter’s LaTeX name with a backslash.ax.set(title=r"$\alpha^{2}$")
-
How can I make superscripts use the same font style as normal text?
Use\mathregular{}.ax.set(title=r"$\mathregular{H^2}$") -
What happens if I forget to use curly brackets for multi-character superscripts?
Only the first character will be raised as a superscript. For example:ax.set(title=r"$x^10$") # Incorrect, renders as x¹⁰ ax.set(title=r"$x^{10}$") # Correct, renders as x¹⁰ -
Can I use Unicode characters for superscripts instead of LaTeX formatting?
Yes, you can use Unicode characters directly.ax.set(title="H²O")

Maisam is a highly skilled and motivated Data Scientist. He has over 4 years of experience with Python programming language. He loves solving complex problems and sharing his results on the internet.
LinkedIn