How to Plot Vectors Using Python Matplotlib
- Understanding Vectors and Their Representation
- Basic Vector Plotting with Matplotlib
- Plotting Multiple Vectors
- Customizing Vector Plots
- Conclusion
- FAQ

Matplotlib is a powerful library in Python that allows for a wide range of visualizations, including plotting vectors. Whether you’re working on data analysis, scientific research, or simply want to visualize mathematical concepts, knowing how to plot vectors can be incredibly beneficial.
In this tutorial, we will explore the steps to plot vectors using Matplotlib, providing clear code examples and explanations to help you understand the process. By the end of this article, you’ll be equipped with the skills necessary to create stunning vector plots in Python, enhancing your data visualization capabilities.
Understanding Vectors and Their Representation
Before diving into the code, let’s clarify what vectors are. In mathematical terms, a vector is an object that has both a magnitude and a direction. In a two-dimensional space, vectors can be represented as arrows, where the length of the arrow indicates the magnitude and the angle indicates the direction.
To plot vectors using Matplotlib, we will utilize the quiver function, which is specifically designed for this purpose. This function allows us to create a grid of arrows that represent the vectors in a specified coordinate system. Now, let’s look at how to implement this in Python.
Basic Vector Plotting with Matplotlib
The simplest way to plot vectors is by using the quiver function in Matplotlib. Below is a basic example to illustrate how you can visualize vectors in a 2D space.
import matplotlib.pyplot as plt
import numpy as np

# Define the origin
origin = np.array([[0, 0], [0, 0]])

# Define the vector components
vectors = np.array([[1, 2], [2, 1]])

# Create the plot
plt.quiver(*origin, vectors[:, 0], vectors[:, 1], angles='xy', scale_units='xy', scale=1)
plt.xlim(-1, 3)
plt.ylim(-1, 3)
plt.grid()
plt.title('Basic Vector Plot')
plt.xlabel('X-axis')
plt.ylabel('Y-axis')
plt.axhline(0, color='black',linewidth=0.5, ls='--')
plt.axvline(0, color='black',linewidth=0.5, ls='--')
plt.show()
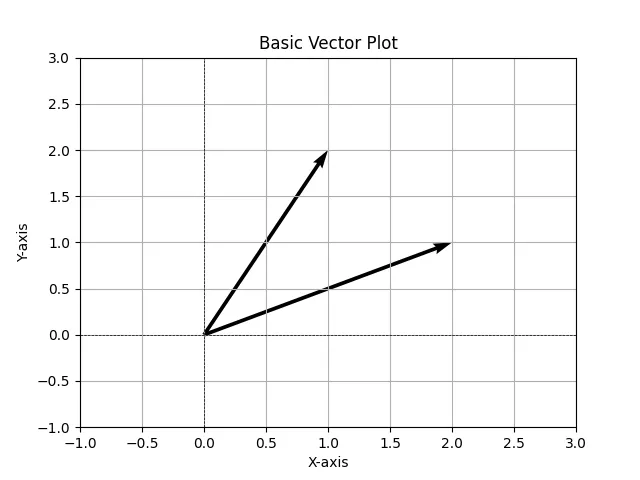
Output:

In this code, we first import the necessary libraries: Matplotlib for plotting and NumPy for numerical operations. We then define the origin of the vectors and the vector components. The quiver function is called to create the arrows, with parameters that specify the angle and scaling. Finally, we set limits for the axes, add a grid, and display the plot. This basic example serves as a foundation for more complex vector visualizations.
Plotting Multiple Vectors
Once you grasp the basics of plotting a single vector, you can easily extend this to multiple vectors. Let’s see how to plot several vectors originating from the same point.
import matplotlib.pyplot as plt
import numpy as np

# Define the origin
origin = np.array([[0, 0], [0, 0], [0, 0]])

# Define multiple vector components
vectors = np.array([[1, 2], [2, 1], [1.5, 1.5]])

# Create the plot
plt.quiver(*origin, vectors[:, 0], vectors[:, 1], angles='xy', scale_units='xy', scale=1)
plt.xlim(-1, 3)
plt.ylim(-1, 3)
plt.grid()
plt.title('Multiple Vector Plot')
plt.xlabel('X-axis')
plt.ylabel('Y-axis')
plt.axhline(0, color='black', linewidth=0.5, ls='--')
plt.axvline(0, color='black', linewidth=0.5, ls='--')
plt.show()
In this example, we define three vectors originating from the same point. The quiver function is again used to draw the arrows. Adjusting the limits and labels remains the same as in the previous example. This method allows you to visualize multiple vectors simultaneously, which can be particularly useful in various applications such as physics and engineering.
Customizing Vector Plots
Customizing your vector plots can significantly enhance their readability and aesthetics. Let’s explore how to modify colors, add labels, and adjust arrow styles.
import matplotlib.pyplot as plt
import numpy as np

# Define the origin
origin = np.array([[0, 0], [0, 0], [0, 0]])

# Define multiple vector components
vectors = np.array([[1, 2], [2, 1], [1.5, 1.5]])

# Create the plot
plt.quiver(*origin, vectors[:, 0], vectors[:, 1], color=['r', 'g', 'b'], angles='xy', scale_units='xy', scale=1)
plt.xlim(-1, 3)
plt.ylim(-1, 3)
plt.grid()
plt.title('Customized Vector Plot')
plt.xlabel('X-axis')
plt.ylabel('Y-axis')
plt.axhline(0, color='black', linewidth=0.5, ls='--')
plt.axvline(0, color='black', linewidth=0.5, ls='--')

# Adding labels to vectors
for i, vec in enumerate(vectors):
    plt.text(vec[0]/2, vec[1]/2, f'Vector {i+1}', fontsize=12, ha='right')

plt.show()
In this code, we customize the vector colors by passing a list of colors to the color parameter in the quiver function. Additionally, we add labels next to each vector using the text function, which helps in identifying each vector easily. Customizations like these can make your visualizations more informative and visually appealing, allowing viewers to grasp the data quickly.
Conclusion
Plotting vectors using Python’s Matplotlib library is a straightforward yet powerful way to visualize data. From basic plots to more complex visualizations with multiple vectors and customizations, the techniques discussed in this tutorial provide a solid foundation for anyone looking to enhance their data visualization skills. Whether you are a student, researcher, or professional, mastering vector plotting can significantly improve your ability to communicate complex ideas effectively.
FAQ
-
What is Matplotlib?
Matplotlib is a popular Python library used for creating static, animated, and interactive visualizations in Python. -
How do I install Matplotlib?
You can install Matplotlib using pip with the commandpip install matplotlib. -
Can I plot 3D vectors using Matplotlib?
Yes, Matplotlib also supports 3D plotting through thempl_toolkits.mplot3dmodule. -
What is the difference between
quiverandarrowin Matplotlib?
Thequiverfunction is used for plotting multiple vectors, whilearrowis used for plotting a single arrow. -
How can I save my vector plot?
You can save your plot usingplt.savefig('filename.png')before callingplt.show().
Manav is a IT Professional who has a lot of experience as a core developer in many live projects. He is an avid learner who enjoys learning new things and sharing his findings whenever possible.
LinkedIn