How to Draw an Arbitrary Line in Matplotlib
-
Matplotlib Draw Arbitrary Lines Using the
matplotlib.pyplot.plot()Method -
Matplotlib Draw Arbitrary Lines Using the
hlines()andvlines()Method -
Matplotlib Draw Arbitrary Lines Using the
matplotlib.collections.LineCollection

This tutorial explains how we can draw arbitrary lines in Matplotlib using the matplotlib.pyplot.plot() method, matplotlib.pyplot.vlines() method or matplotlib.pyplot.hlines() method and matplotlib.collections.LineCollection.
Matplotlib Draw Arbitrary Lines Using the matplotlib.pyplot.plot() Method
We can simply plot a line using the matplotlib.pyplot.plot() method. The general syntax to plot any line begining from (x1,y1) and ending at (x2,y2) is:
plot([x1, x2], [y1, y2])
import matplotlib.pyplot as plt

plt.plot([3, 5], [1, 6], color="green")
plt.plot([0, 5], [0, 5], color="red")
plt.xlabel("X")
plt.ylabel("Y")
plt.title("Plot with 2 arbitrary Lines")
plt.show()
Output:

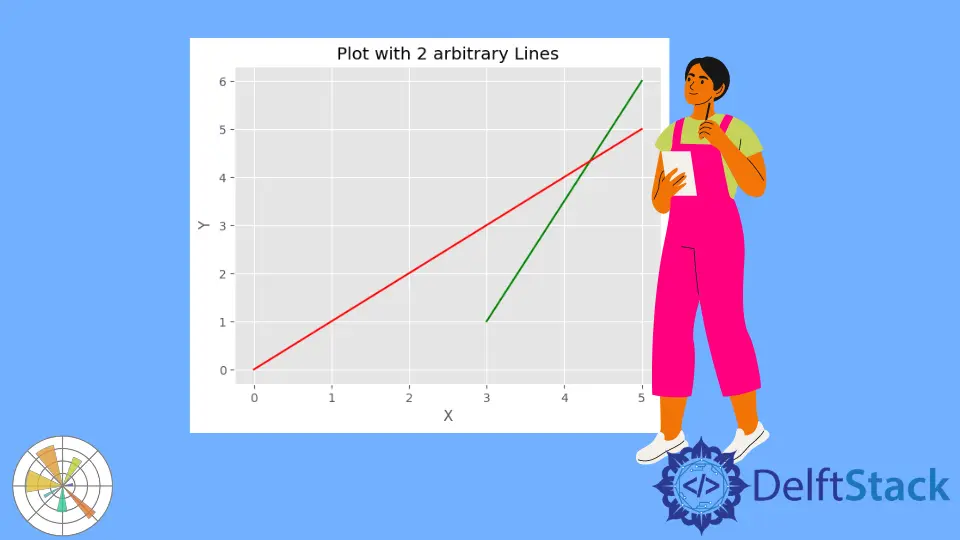
It draws two arbitrary lines in the figure. The first line represented by green color extends from (3,1) to (5,6), and the second line represented by red color extends from (0,0) to (5,5).
Matplotlib Draw Arbitrary Lines Using the hlines() and vlines() Method
The general syntax to draw any line using the hlines() and vlines() methods is:
vlines(x, ymin, ymax)
hlines(y, xmin, xmax)
import matplotlib.pyplot as plt

plt.hlines(3, 2, 5, color="red")
plt.vlines(6, 1, 5, color="green")
plt.xlabel("X")
plt.ylabel("Y")
plt.title("Plot arbitrary Lines")
plt.show()
Output:

The hlines() method draws a horizontal line in red color whose Y co-ordinate remains 3 throughout the line, and the X co-ordinate extends from 2 to 5. The vlines() method draws a vertical line in green color whose X co-ordinate remains 6 throughout the line, and the Y co-ordinate extends from 1 to 5.
Matplotlib Draw Arbitrary Lines Using the matplotlib.collections.LineCollection
import matplotlib.pyplot as plt
from matplotlib import collections

line_1 = [(1, 10), (6, 9)]
line_2 = [(1, 7), (3, 6)]

collection_1_2 = collections.LineCollection([line_1, line_2], color=["red", "green"])

fig, axes = plt.subplots(1, 1)
axes.add_collection(collection_1_2)
axes.autoscale()
plt.show()
Output:

It creates the line collection from line_1 and line_2 and then adds the collection to the plot.
Suraj Joshi is a backend software engineer at Matrice.ai.
LinkedIn