How to Set a Single Main Title for All the Subplots in Matplotlib
-
pyplot.suptitle()to Add Main Title for All the Subplots -
figure.suptitle()to Add Main Title for All the Subplots

We use set_title(label) and title.set_text(label) methods to add titles to individual subplots in Matplotlib. However, to add a main title common to all the subplots we use pyplot.suptitle() or Figure.suptitle() methods.
pyplot.suptitle() to Add Main Title for All the Subplots
We use matplotlib.pyplot.suptitle() method to set main title common to all subplots in Matplotlib.
import numpy as np
import matplotlib.pyplot as plt

m1 = 1
c1 = 0

m2 = 2
c2 = 2

m3 = 2
c3 = 1

m4 = 1
c4 = 2

x = np.linspace(0, 3, 100)
y1 = m1 * x + c1
y2 = m2 * x + c2
y3 = m3 * x + c3
y4 = m4 * x + c4

fig, ax = plt.subplots(2, 2, figsize=(10, 8))

ax[0, 0].plot(x, y1)
ax[0, 1].plot(x, y2)
ax[1, 0].plot(x, y3)
ax[1, 1].plot(x, y4)

ax[0, 0].set_title("Line-1")
ax[0, 1].set_title("Line-2")
ax[1, 0].set_title("Line-3")
ax[1, 1].set_title("Line-4")

plt.suptitle("Various Straight Lines", fontsize=20)

fig.tight_layout()
plt.show()
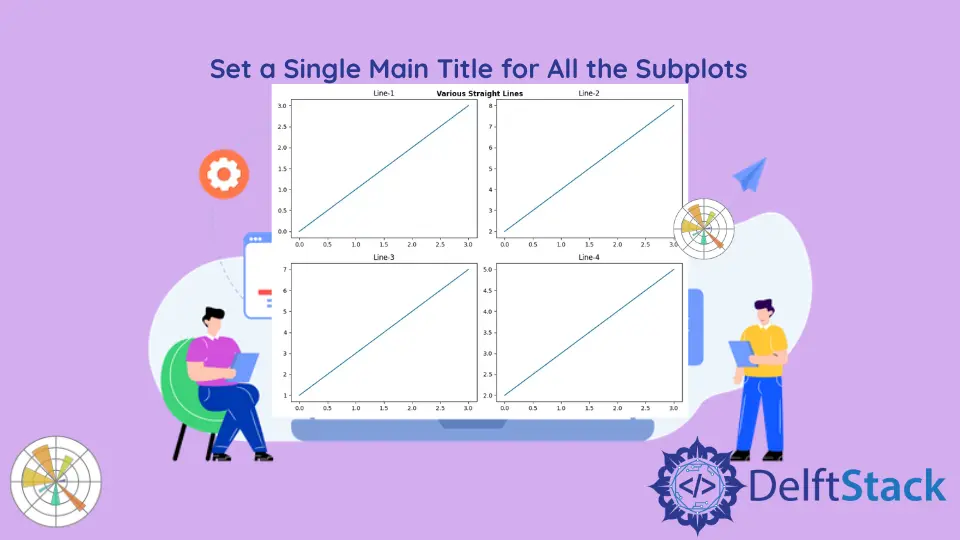
Output:

In this example , axes.set_title() method is used to add title to individual subplots while plt.suptitle() method is used to add main title common for all subplots. We can specify various parameters such as x co-ordinate, y co-ordinate, font size and alignments using various parameters to the plt.suptitle() method. In this case, the fontsize=20 is set to make the main title distinguishable from the titles of each subplot.
figure.suptitle() to Add Main Title for All the Subplots
matplotlib.figure.Figure.suptitle() method is also used to set the main title for all subplots in a figure.
import numpy as np
import matplotlib.pyplot as plt

m1 = 1
c1 = 0

m2 = 2
c2 = 2

m3 = 2
c3 = 1

m4 = 1
c4 = 2

x = np.linspace(0, 3, 100)
y1 = m1 * x + c1
y2 = m2 * x + c2
y3 = m3 * x + c3
y4 = m4 * x + c4

fig, ax = plt.subplots(2, 2, figsize=(10, 8))

ax[0, 0].plot(x, y1)
ax[0, 1].plot(x, y2)
ax[1, 0].plot(x, y3)
ax[1, 1].plot(x, y4)

ax[0, 0].set_title("Line-1")
ax[0, 1].set_title("Line-2")
ax[1, 0].set_title("Line-3")
ax[1, 1].set_title("Line-4")

fig.suptitle("Various Straight Lines", fontweight="bold")

fig.tight_layout()
plt.show()
Output:

Suraj Joshi is a backend software engineer at Matrice.ai.
LinkedIn