HOWTO · Matplotlib
How to Rotate X-Axis Tick Label Text in Matplotlib
This tutorial introduces how to rotate x-axis xtickslabel text in Matplotlib.
In this tutorial article, we will introduce different methods to rotate X-axis tick label text in Python label. It includes,
plt.xticks(rotation= )fig.autofmt_xdate(rotation= )ax.set_xticklabels(xlabels, rotation= )plt.setp(ax.get_xticklabels(), rotation=)ax.tick_params(axis='x', labelrotation= )
The default orientation of the text of tick labels in the x-axis is horizontal or 0 degree. It brings inconvience if the tick label text is too long, like overlapping between adjacent label texts.
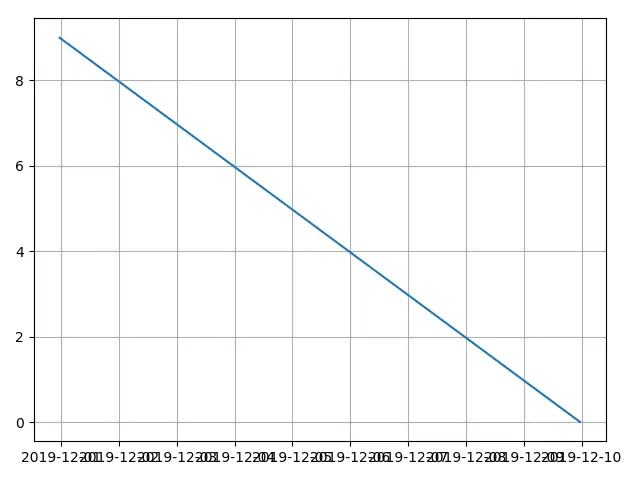
The codes to create the above figure is,
from matplotlib import pyplot as plt
from datetime import datetime, timedelta

values = range(10)
dates = [datetime.now() - timedelta(days=_) for _ in range(10)]

fig, ax = plt.subplots()
plt.plot(dates, values)
plt.grid(True)

plt.show()
plt.xticks(rotation= ) to Rotate Xticks Label Text
from matplotlib import pyplot as plt
from datetime import datetime, timedelta

values = range(10)
dates = [datetime.now() - timedelta(days=_) for _ in range(10)]

fig, ax = plt.subplots()
plt.plot(dates, values)
plt.xticks(rotation=45)
plt.grid(True)

plt.show()
plt.xticks(rotation=45)
plt.xticks gets or sets the properties of tick locations and labels of the x-axis.
rotation is the counter-clockwise rotation angle of x-axis label text.
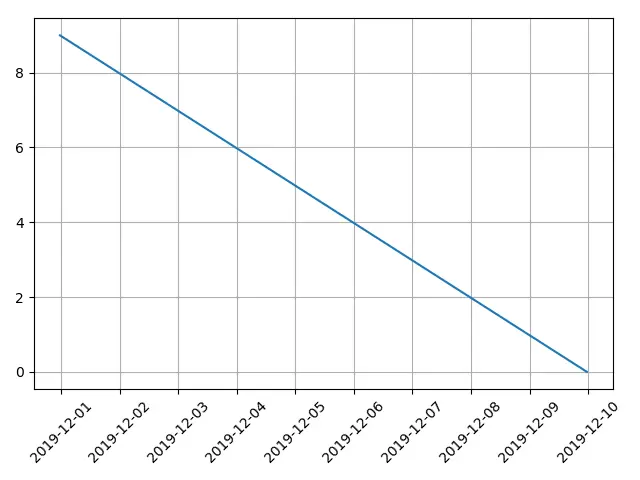
fig.autofmt_xdate(rotation= ) to Rotate Xticks Label Text
from matplotlib import pyplot as plt
from datetime import datetime, timedelta

values = range(10)
dates = [datetime.now() - timedelta(days=_) for _ in range(10)]

fig, ax = plt.subplots()
plt.plot(dates, values)
fig.autofmt_xdate(rotation=45)
plt.grid(True)

plt.show()
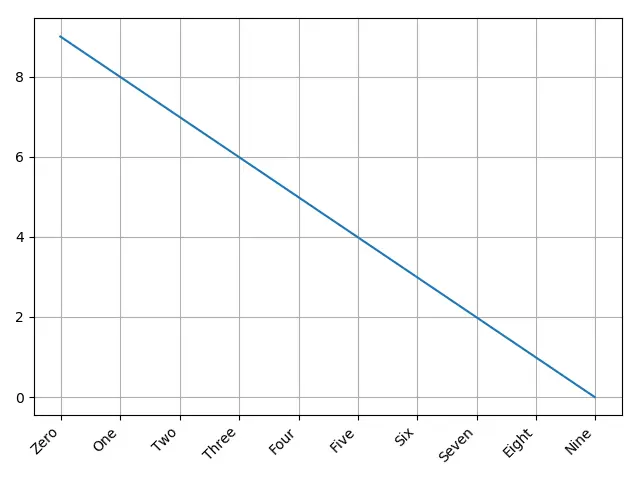
autofmt_xdate rotates the tick labels and right aligns them automatically if the label is date object.
But it works actually not only with the date object but also normal label text string.
from matplotlib import pyplot as plt
from datetime import datetime, timedelta

values = range(10)
dates = [datetime.now() - timedelta(days=_) for _ in range(10)]
xlabels = [
    "Zero",
    "One",
    "Two",
    "Three",
    "Four",
    "Five",
    "Six",
    "Seven",
    "Eight",
    "Nine",
]

fig, ax = plt.subplots()
plt.plot(dates, values)
ax.set_xticklabels(xlabels)
fig.autofmt_xdate(rotation=45)
plt.grid(True)

plt.show()
ax.set_xticklabels(xlabels, Rotation= ) to Rotate Xticks Label Text
set_xticklabels sets the x-tick labels with list of string labels.
This list of string labels could be a newly specified list or the current plot’s existing label list read by get_xticklabels().
from matplotlib import pyplot as plt
from datetime import datetime, timedelta

values = range(10)
dates = [datetime.now() - timedelta(days=_) for _ in range(10)]
xlabels = [
    datetime.strftime(datetime.now() - timedelta(days=_), "%m/%d/%Y") for _ in range(10)
]

fig, ax = plt.subplots()
plt.plot(dates, values)
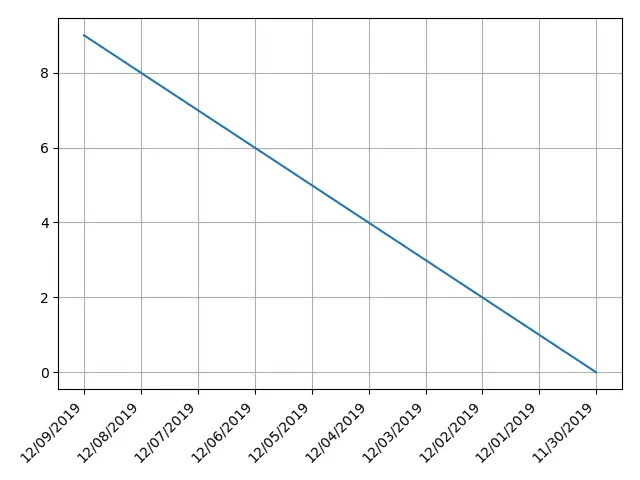
ax.set_xticklabels(xlabels, rotation=45, ha="right")
plt.grid(True)

plt.show()
plt.setp(ax.get_xticklabels(), Rotation=) to Rotate Xticks Label Text
matplotlib.pyplot.setp sets a property on an artist object.
plt.setp(ax.get_xticklabels(), rotation=) sets the rotation property of xtick labels object.
from matplotlib import pyplot as plt
from datetime import datetime, timedelta

values = range(10)
dates = [datetime.now() - timedelta(days=_) for _ in range(10)]
xlabels = [
    datetime.strftime(datetime.now() - timedelta(days=_), "%m/%d/%Y") for _ in range(10)
]

fig, ax = plt.subplots()
plt.plot(dates, values)
plt.setp(ax.get_xticklabels(), rotation=45, ha="right")
plt.grid(True)

plt.tight_layout()

plt.show()
ax.tick_params(axis='x', Labelrotation= ) to Rotate Xticks Label Text
tick_params sets the parameters of ticks, tick labels and gridlines.
ax.tick_params(axis='x', labelrotation= ) sets the labelrotation property of tick label in x axis, or in other words, X-axis.
from matplotlib import pyplot as plt
from datetime import datetime, timedelta

values = range(10)
dates = [datetime.now() - timedelta(days=_) for _ in range(10)]
xlabels = [
    datetime.strftime(datetime.now() - timedelta(days=_), "%m/%d/%Y") for _ in range(10)
]

fig, ax = plt.subplots()
plt.plot(dates, values)

ax.tick_params(axis="x", labelrotation=45)
plt.grid(True)

plt.show()
Rotated xticklabels Aligning
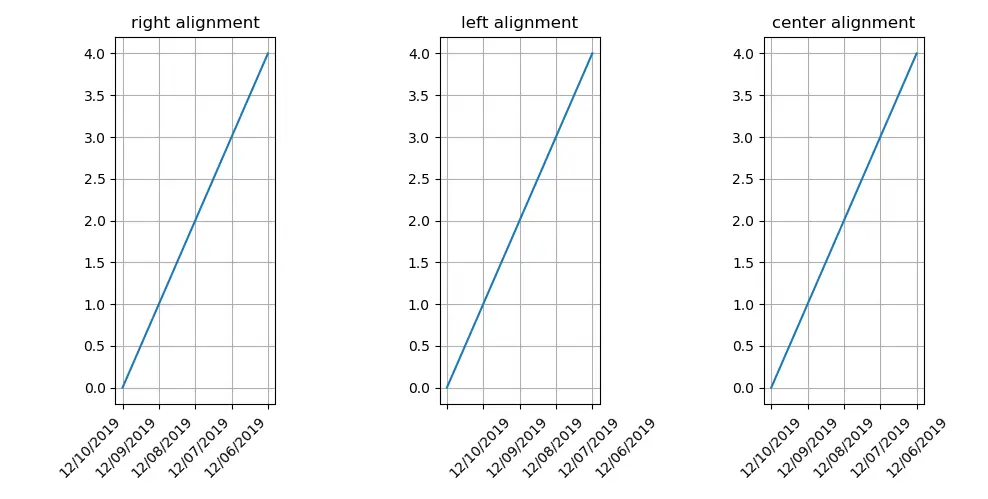
we use argument ha='right' in the above example codes, which means horizontal alignment is right.
ha='right' aligns the right end of the label text to the ticks.
ha='left' aligns the left end of the label text to the ticks.
ha='center' aligns the center of the label text to the ticks.
from matplotlib import pyplot as plt
from datetime import datetime, timedelta

xvalues = range(5)
yvalues = xvalues
xlabels = [
    datetime.strftime(datetime.now() - timedelta(days=_), "%m/%d/%Y") for _ in xvalues
]

alignment = ["right", "left", "center"]
fig, axes = plt.subplots(1, 3)


for n, ax in enumerate(axes):
    ax.plot(xvalues, yvalues)
    ax.set_title(alignment[n] + "alignment")
    ax.set_xticks(xvalues)
    ax.set_xticklabels(xlabels, rotation=45, ha=alignment[n])
    ax.grid(True)

plt.show()