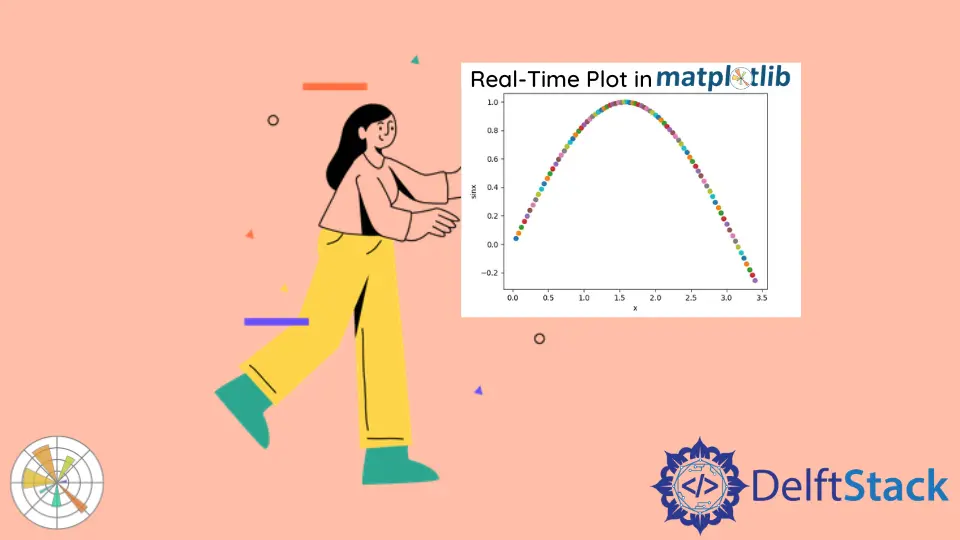
How to Plot Data in Real Time Using Matplotlib

To plot data in real-time using Matplotlib, or make an animation in Matplotlib, we constantly update the variables to be plotted by iterating in a loop and then plotting the updated values. To view the updated plot in real-time through animation, we use various methods such as FuncAnimation() function, canvas.draw() along with canvas_flush_events().
FuncAnimation() Function
We can update the plot in real-time by updating the variables x and y and then displaying updates through animation using matplotlib.animation.FuncAnimation.
Syntax:
matplotlib.animation.FuncAnimation(fig,
                                   func,
                                   frames=None,
                                   init_func=None,
                                   fargs=None,
                                   save_count=None,
                                   *,
                                   cache_frame_data=True,
                                   **kwargs)
Code:
import numpy as np
import matplotlib.pyplot as plt
from matplotlib.animation import FuncAnimation

x = []
y = []

figure, ax = plt.subplots(figsize=(4, 3))
(line,) = ax.plot(x, y)
plt.axis([0, 4 * np.pi, -1, 1])


def func_animate(i):
    x = np.linspace(0, 4 * np.pi, 1000)
    y = np.sin(2 * (x - 0.1 * i))

    line.set_data(x, y)

    return (line,)


ani = FuncAnimation(figure, func_animate, frames=10, interval=50)

ani.save(r"animation.gif", fps=10)

plt.show()

ani = FuncAnimation(figure, func_animate, frames=10, interval=50)
figure is the figure object whose plot will be updated.
func_animate is the function to be called at each frame. Its first argument comes from the next value frames.
frames=10 is equal to range(10). Values from 0 to 9 is passed to the func_animate at each frame. We could also assign an interalbe to frames, like a list [0, 1, 3, 7, 12].
interval is the delay between frames in the unit of ms.
ani.save("animation.gif", fps=10)
We could save the animation to a gif or mp4 with the parameters like fps and dpi.
canvas.draw() Along With canvas_flush_events()
We can update the plot in real-time by updating the variables x and y with set_xdata() and set_ydata() and then displaying updates through animation using canvas.draw(), which is a method based on JavaScript.
import numpy as np
import time
import matplotlib.pyplot as plt

x = np.linspace(0, 10, 100)
y = np.cos(x)

plt.ion()

figure, ax = plt.subplots(figsize=(8, 6))
(line1,) = ax.plot(x, y)

plt.title("Dynamic Plot of sinx", fontsize=25)

plt.xlabel("X", fontsize=18)
plt.ylabel("sinX", fontsize=18)

for p in range(100):
    updated_y = np.cos(x - 0.05 * p)

    line1.set_xdata(x)
    line1.set_ydata(updated_y)

    figure.canvas.draw()

    figure.canvas.flush_events()
    time.sleep(0.1)

Here the values of x and y get updated repeatedly and the plot also gets updated in real time.
plt.ion() turns on the interactive mode. The plot will not be updated if it is not called.
canvas.flush_events() is method based on JavaScript to clear figures on every iterations so that successive figures might not overlap.
Real Time Scatter Plot
However, to make a real-time scatter, we can just update the values of x and y and add scatter points in each iteration. In this case, we need not clear every figure as a scatter plot generally represents a distinct point in the plane and the points have very little chance of overlapping.
import numpy as np
import matplotlib.pyplot as plt

x = 0
for i in range(100):
    x = x + 0.04
    y = np.sin(x)
    plt.scatter(x, y)
    plt.title("Real Time plot")
    plt.xlabel("x")
    plt.ylabel("sinx")
    plt.pause(0.05)

plt.show()

Suraj Joshi is a backend software engineer at Matrice.ai.
LinkedIn