How to Display an Image With Matplotlib Python
- Importing Necessary Libraries
- Loading an Image
- Customizing Image Display
- Saving the Displayed Image
- Conclusion
- FAQ

Matplotlib is a powerful library in Python widely used for data visualization. One of its most useful features is the ability to display images. Whether you’re working with scientific data or creating visual art, Matplotlib’s pyplot.imshow() method makes it easy to render images in your Python scripts.
In this article, we will explore how to display an image using Matplotlib, walking through the essential steps and providing clear code examples. By the end, you’ll be equipped with the knowledge to incorporate images into your visualizations seamlessly. So, let’s dive into the world of image display with Matplotlib!
Importing Necessary Libraries
Before you can display an image using Matplotlib, you need to import the necessary libraries. The most important one is matplotlib.pyplot, which provides the imshow() method. Additionally, you may want to use numpy for handling image data, especially if you plan to manipulate the images.
Here’s how to import the libraries:
import matplotlib.pyplot as plt
import numpy as np
To begin, you first need to import the libraries required for displaying images. The matplotlib.pyplot module is essential for most plotting tasks, while numpy is useful for numerical operations, especially when dealing with image data.
Loading an Image
Once you have your libraries ready, the next step is to load an image. You can use the imread() function from matplotlib.pyplot to read an image file from your local directory. This function will return a NumPy array representing the image, which can then be displayed using imshow().
Here’s a simple example of how to load and display an image:
image = plt.imread('path_to_your_image.jpg')
plt.imshow(image)
plt.axis('off')
plt.show()
In this code snippet, we first read the image using plt.imread(), specifying the path to the image file. After loading the image, we use plt.imshow(image) to display it. The plt.axis('off') command removes the axis ticks and labels for a cleaner look. Finally, plt.show() renders the image window.
Output:

Loading an image is a straightforward process with Matplotlib. Just ensure the path to your image is correct, and you’ll be able to visualize it in no time!
Customizing Image Display
Matplotlib allows for extensive customization of how images are displayed. You can adjust parameters such as color maps, interpolation methods, and aspect ratios to enhance your visualizations. For instance, you can change the color map to grayscale or apply interpolation to improve the image quality.
Here’s an example of how to customize the display of an image:
plt.imshow(image.mean(axis=2), cmap='gray', interpolation='bicubic')
plt.axis('off')
plt.show()
In this example, we added two parameters to the imshow() method. image.mean(axis=2) calculates the average of the red, green, and blue color channel values for each pixel in an RGB image, effectively converting it to a grayscale representation. The cmap='gray' argument changes the color map to grayscale, while interpolation='bicubic' applies bicubic interpolation for smoother image rendering. As before, plt.axis('off') ensures no axis ticks or labels are shown.
Output:
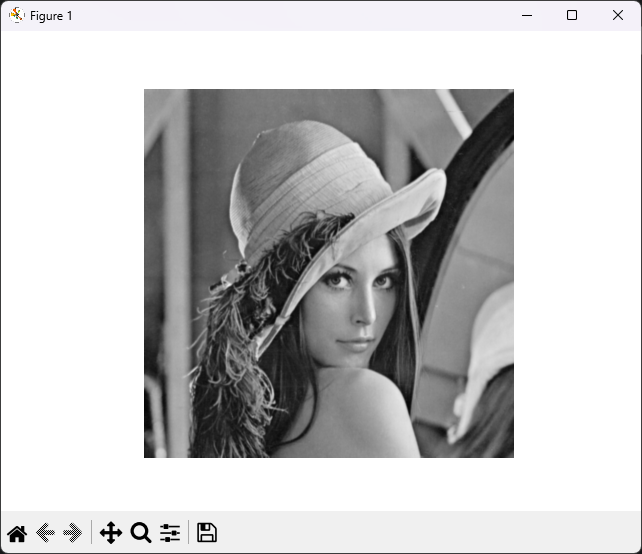
Customizing your image display can significantly enhance the visual appeal and clarity of your visualizations. Experimenting with different parameters can lead to unique and informative presentations of your data.
Saving the Displayed Image
After displaying an image, you may want to save it for future use or sharing. Matplotlib provides a simple way to save figures using the savefig() function. You can specify the filename and the format in which to save the image.
Here’s how to save a displayed image:
plt.imshow(image)
plt.axis('off')
plt.savefig('saved_image.png', bbox_inches='tight', pad_inches=0)
In this code, we display the image as before. However, instead of using plt.show(), we call plt.savefig(), specifying the desired filename and format (in this case, PNG). The bbox_inches='tight' argument ensures that the saved image has minimal whitespace around it, and pad_inches=0 removes any padding.
Saving images is a handy feature, especially when you want to keep a record of your visualizations or share them with colleagues. With just a few lines of code, you can create high-quality images for reports or presentations.
Conclusion
Displaying images using Matplotlib in Python is a straightforward yet powerful way to enhance your data visualizations. By importing the necessary libraries, loading images, customizing their display, and saving them for future use, you can create visually appealing graphics that effectively communicate your data. Whether you’re a data scientist, researcher, or hobbyist, mastering these techniques will elevate your Python programming skills. So, get started with Matplotlib and explore the endless possibilities of image display in your projects!
FAQ
- How do I install Matplotlib?
You can install Matplotlib using pip with the command pip install matplotlib.
-
Can I display multiple images at once?
Yes, you can use subplots to display multiple images in a single figure. -
What image formats can I use with Matplotlib?
Matplotlib supports various formats, including JPEG, PNG, BMP, and TIFF. -
How can I adjust the size of the displayed image?
You can set the figure size using plt.figure(figsize=(width, height)) before calling imshow(). -
Is it possible to display images from a URL?
Yes, you can use libraries likerequeststo fetch images from URLs and display them with Matplotlib.

Suraj Joshi is a backend software engineer at Matrice.ai.
LinkedIn