How to Create Multiple Axes in Matplotlib

In this tutorial of the Matplotlib, we will look at a short introduction about axes instances and see how to add multiple axes instances to a figure with the help of the add_axes() method in Matplotlib.
Create Multiple Axes With the add_axes() Method in Matplotlib
To add an axis or multiple axes instance in Matplotlib, use the add_axes() method. We need to assign them to a region within the figure when adding axes.
We specify the coordinates of its lower-left corner and its size and the coordinates in the add_axes() method. The range should be 0 to 1, and we also specify width and height proportional rather than absolute.
Let’s start by importing all the modules required.
import matplotlib.pyplot as plot
import numpy as np
import matplotlib as mpl
We create a figure, and the figsize is 8 by 6 inches. Set its background color to yellow using the facecolor argument.
figure = plot.figure(figsize=(8, 6), facecolor="yellow")
Add the three-axes instances using the add_axes() method. The method accepts a tuple to define orientation.
The first parameter is the coordinate x, the second y coordinate, the third width and the fourth is the height. We will also set the facecolor as 'cyan'.
axes1 = figure.add_axes((0.1, 0.1, 0.5, 0.4), facecolor="cyan")
axes2 = figure.add_axes((0.3, 0.6, 0.3, 0.3), facecolor="cyan")
axes3 = figure.add_axes((0.7, 0.1, 0.2, 0.8), facecolor="cyan")
We define the x and y values. We will use some functions from the numpy library.
x1 = np.linspace(0.10, 10, 100)
y1 = 10 * np.sin(x1)
Now, we display the plot for three instances of axes. The parameters x1, y1 and color as "navy".
axes1.plot(x1, y1, color="navy")
axes2.plot(x1, y1, color="navy")
axes3.plot(x1, y1, color="navy")
Full Source Code:
import matplotlib.pyplot as plot
import numpy as np
import matplotlib as mpl

figure = plot.figure(figsize=(8, 6), facecolor="yellow")

axes1 = figure.add_axes((0.1, 0.1, 0.5, 0.4), facecolor="cyan")
axes2 = figure.add_axes((0.3, 0.6, 0.3, 0.3), facecolor="cyan")
axes3 = figure.add_axes((0.7, 0.1, 0.2, 0.8), facecolor="cyan")

x1 = np.linspace(0.10, 10, 100)
y1 = 10 * np.sin(x1)

axes1.plot(x1, y1, color="navy")
axes2.plot(x1, y1, color="navy")
axes3.plot(x1, y1, color="navy")
plot.show()
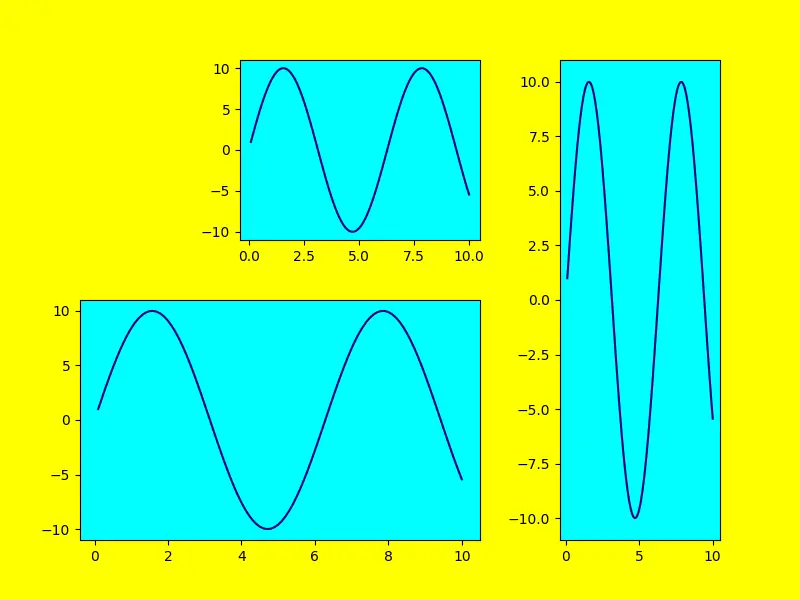
We’ll get a figure with three-axis instances. In this figure, we can view all coordinate points with corresponding axes.
Output:
-Method-in-Matplotlib.webp)
Hello! I am Salman Bin Mehmood(Baum), a software developer and I help organizations, address complex problems. My expertise lies within back-end, data science and machine learning. I am a lifelong learner, currently working on metaverse, and enrolled in a course building an AI application with python. I love solving problems and developing bug-free software for people. I write content related to python and hot Technologies.
LinkedIn