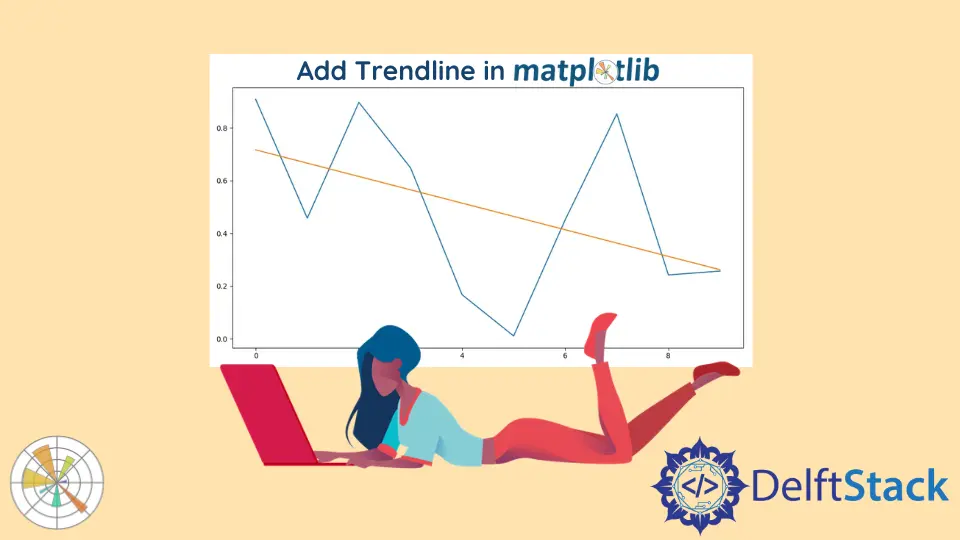
How to Add Trendline in Python Matplotlib
- Understanding Trendlines
- Adding a Simple Linear Trendline
- Adding a Polynomial Trendline
- Adding a Trendline with Seaborn
- Conclusion
- FAQ

Matplotlib is one of the most popular libraries in Python for data visualization. Whether you’re creating simple plots or complex graphs, adding a trendline can significantly enhance the interpretability of your data. A trendline helps to visualize the underlying trend in your data, making it easier to identify patterns and predict future values.
In this article, we will explore how to add and calculate a trendline in Matplotlib, providing you with clear examples and explanations. By the end, you’ll be equipped to incorporate trendlines into your visualizations, thus elevating your data presentation skills.
Understanding Trendlines
Before diving into the code, let’s clarify what a trendline is. A trendline is a line that represents the general direction of your data. It can be linear, polynomial, or even exponential, depending on the nature of your dataset. In Python, Matplotlib allows you to add trendlines to your plots easily. The most common way to calculate a trendline is through linear regression, which fits a straight line to your data points.
Adding a Simple Linear Trendline
To add a simple linear trendline to your Matplotlib plot, you can use NumPy for linear regression. Here’s how you can do it:
import numpy as np
import matplotlib.pyplot as plt

# Sample data
x = np.array([1, 2, 3, 4, 5])
y = np.array([2, 3, 5, 7, 11])

# Create a scatter plot
plt.scatter(x, y)

# Calculate the trendline
m, b = np.polyfit(x, y, 1)

# Add trendline to the plot
plt.plot(x, m*x + b, color='red')

plt.title("Scatter Plot with Trendline")
plt.xlabel("X-axis")
plt.ylabel("Y-axis")
plt.show()
Output:
A scatter plot with a red linear trendline.
In this code, we first import the necessary libraries. We create sample data points using NumPy arrays. The plt.scatter function generates a scatter plot of the data points. The np.polyfit function is then used to calculate the slope (m) and intercept (b) of the best-fit line. Finally, we plot the trendline using plt.plot, specifying the color red for visibility. This simple approach effectively illustrates how a trendline can enhance the understanding of your data.
Adding a Polynomial Trendline
Sometimes, your data might not fit well with a linear trendline. In such cases, a polynomial trendline can provide a better fit. Here’s how to add a polynomial trendline using Matplotlib:
import numpy as np
import matplotlib.pyplot as plt

# Sample data
x = np.array([1, 2, 3, 4, 5])
y = np.array([2, 3, 5, 7, 11])

# Create a scatter plot
plt.scatter(x, y)

# Calculate the polynomial trendline (degree 2)
coefficients = np.polyfit(x, y, 2)
poly_eq = np.poly1d(coefficients)

# Add trendline to the plot
plt.plot(x, poly_eq(x), color='green')

plt.title("Scatter Plot with Polynomial Trendline")
plt.xlabel("X-axis")
plt.ylabel("Y-axis")
plt.show()
Output:
A scatter plot with a green polynomial trendline.
In this example, we again create a scatter plot of the sample data. However, this time we use np.polyfit with a degree of 2 to calculate the coefficients for a quadratic equation. The np.poly1d function generates a polynomial function from these coefficients. By plotting this polynomial function, we add a smooth curve as the trendline, which may better represent the underlying relationship in the data. This method is particularly useful for datasets that exhibit non-linear trends.
Adding a Trendline with Seaborn
If you prefer a more straightforward approach, you can use Seaborn, a statistical data visualization library built on top of Matplotlib. Seaborn simplifies the process of adding trendlines to your plots. Here’s how to do it:
import seaborn as sns
import matplotlib.pyplot as plt
import numpy as np

# Sample data
x = np.array([1, 2, 3, 4, 5])
y = np.array([2, 3, 5, 7, 11])

# Create a DataFrame
import pandas as pd
data = pd.DataFrame({'X': x, 'Y': y})

# Create a scatter plot with a trendline
sns.regplot(x='X', y='Y', data=data, color='blue')

plt.title("Scatter Plot with Seaborn Trendline")
plt.xlabel("X-axis")
plt.ylabel("Y-axis")
plt.show()
Output:
A scatter plot with a blue trendline using Seaborn.
In this code snippet, we import Seaborn and create a DataFrame to hold our data. The sns.regplot function generates a scatter plot and automatically fits a linear regression line to the data. This method is incredibly user-friendly and requires minimal code. Seaborn takes care of the underlying calculations, allowing you to focus more on the visualization aspect.
Conclusion
Adding trendlines in Matplotlib is a straightforward process that can significantly enhance your data visualizations. Whether you opt for a simple linear trendline, a polynomial curve, or leverage the capabilities of Seaborn, each method offers unique advantages. By understanding how to implement these techniques, you can provide clearer insights into your data and effectively communicate your findings. As you continue to explore the world of data visualization, remember that a well-placed trendline can make all the difference in how your audience interprets your data.
FAQ
- What is a trendline?
A trendline is a line that represents the general direction of your data, helping to identify patterns and trends.
-
How do I choose the right type of trendline?
The choice of trendline depends on the nature of your data. Use linear for simple relationships, polynomial for curved data, and exponential for growth trends. -
Can I customize the appearance of the trendline in Matplotlib?
Yes, you can customize the color, line style, and width of the trendline using parameters in theplt.plotfunction. -
Is it necessary to use libraries like NumPy or Seaborn for trendlines?
While you can manually calculate trendlines, libraries like NumPy and Seaborn simplify the process and make your code cleaner. -
How can I visualize multiple trendlines on the same plot?
You can add multiple trendlines by repeating the plotting commands for each dataset, ensuring to use different colors or line styles for clarity.
Hi, my name is Maxim Maeder, I am a young programming enthusiast looking to have fun coding and teaching you some things about programming.
GitHub