MATLAB RGB Triplet
- Understanding RGB Triplets in MATLAB
- Method 1: Basic Plotting with RGB Triplets
- Method 2: Using RGB Triplets in Scatter Plots
- Method 3: Customizing Bar Charts with RGB Triplets
- Conclusion
- FAQ
When it comes to data visualization, color plays a vital role in conveying information effectively. In MATLAB, one of the most powerful tools for scientific computing and visualization, you can customize the colors of your plots using RGB triplets. An RGB triplet is a three-element vector that represents the intensity of red, green, and blue components of a color. By mastering the use of RGB triplets, you can create visually appealing plots that enhance the clarity of your data.
In this article, we will explore how to set colors in MATLAB using RGB triplets, along with practical examples to illustrate the process.
Understanding RGB Triplets in MATLAB
RGB triplets in MATLAB are expressed as a three-element vector, where each element ranges from 0 to 1. The first element denotes the intensity of red, the second represents green, and the third indicates blue. For example, the RGB triplet [1, 0, 0] corresponds to pure red, while [0, 1, 0] is pure green, and [0, 0, 1] is pure blue. You can also create shades by mixing these colors. For instance, [0.5, 0.5, 0] yields a shade of yellow.
To apply these RGB triplets in your plots, you can use them in various plotting functions. The flexibility of RGB colors allows you to create customized visualizations that stand out and communicate your data effectively. Now, let’s delve into some practical methods for using RGB triplets in MATLAB.
Method 1: Basic Plotting with RGB Triplets
One of the simplest ways to use RGB triplets in MATLAB is through basic plotting functions like plot, scatter, and bar. Here’s a straightforward example of how to create a line plot with custom colors.
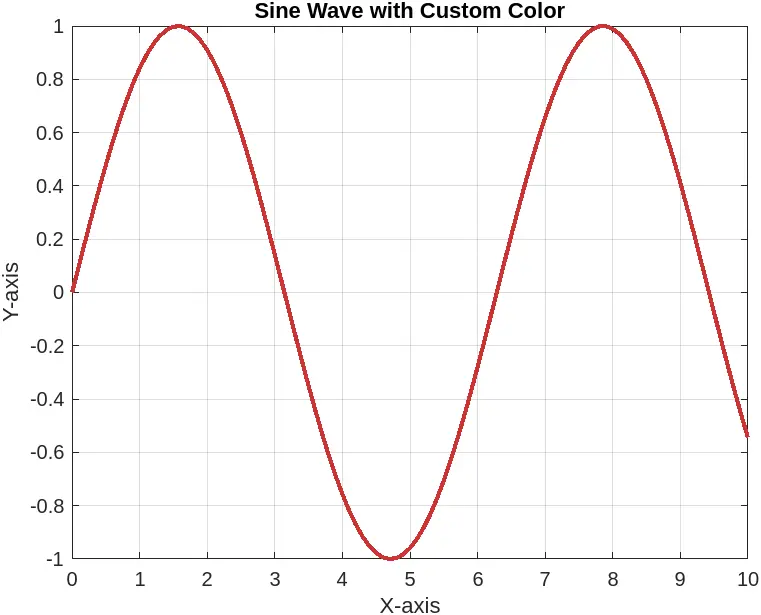
x = 0:0.1:10;
y = sin(x);
plot(x, y, 'Color', [0.8, 0.2, 0.2], 'LineWidth', 2);
title('Sine Wave with Custom Color');
xlabel('X-axis');
ylabel('Y-axis');
grid on;
In this code snippet, we generate a sine wave and customize its color using the RGB triplet [0.8, 0.2, 0.2]. The plot function creates the line plot, and the ‘Color’ property is set to our desired RGB triplet. Additionally, we adjust the line width for better visibility. This method is ideal for quick visualizations where you want to emphasize certain data trends.
Output:
By using this method, you can easily create plots that are not only informative but also visually appealing. The ability to customize colors with RGB triplets enhances your control over how data is presented, making it easier for your audience to understand the insights you wish to convey.
Method 2: Using RGB Triplets in Scatter Plots
Scatter plots are another excellent way to visualize data, especially when dealing with multiple data points. You can use RGB triplets to assign different colors to each point or group of points. Here’s how you can do that in MATLAB.
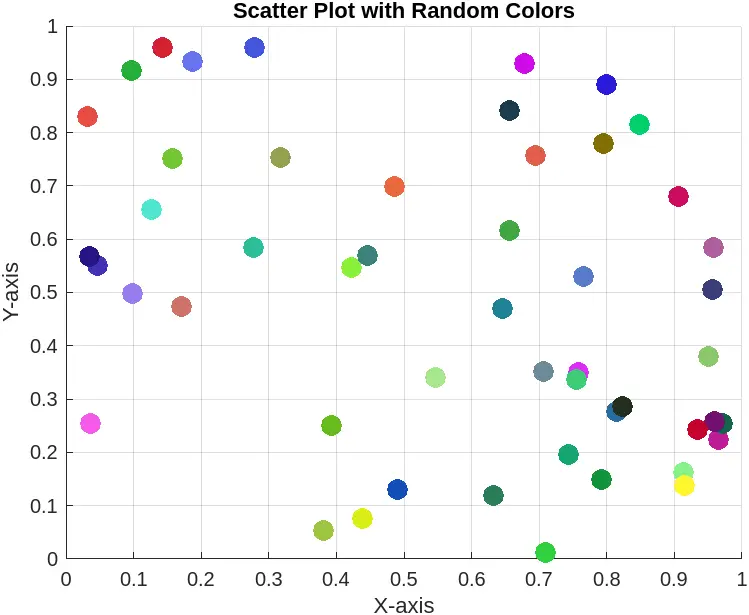
x = rand(1, 50);
y = rand(1, 50);
colors = rand(50, 3);
scatter(x, y, 100, colors, 'filled');
title('Scatter Plot with Random Colors');
xlabel('X-axis');
ylabel('Y-axis');
grid on;
In this example, we generate random x and y coordinates for 50 points. The colors variable is a matrix of random RGB triplets, where each row corresponds to a different point’s color. The scatter function creates the scatter plot, and the ‘filled’ option fills the markers with the specified colors. This method is particularly useful for visualizing clusters or distributions within your data.
Output:
By utilizing RGB triplets in scatter plots, you can create vibrant visualizations that effectively communicate the diversity of your data. This method enhances your ability to identify patterns and outliers, making your analysis more robust and insightful.
Method 3: Customizing Bar Charts with RGB Triplets
Bar charts are a staple in data visualization, allowing you to compare different categories easily. You can also customize the colors of each bar using RGB triplets. Here’s an example of how to create a bar chart with different colors for each bar.
categories = {'A', 'B', 'C', 'D'};
values = [3, 5, 2, 8];
barHandle = bar(values);
colors = [0.2, 0.6, 0.8; 0.8, 0.2, 0.2; 0.2, 0.8, 0.2; 0.5, 0.5, 0.2];
for k = 1:length(barHandle)
    barHandle(k).FaceColor = 'flat';
    barHandle(k).CData = colors(k, :);
end
title('Bar Chart with Custom Colors');
xlabel('Categories');
ylabel('Values');
set(gca, 'XTickLabel', categories);
grid on;
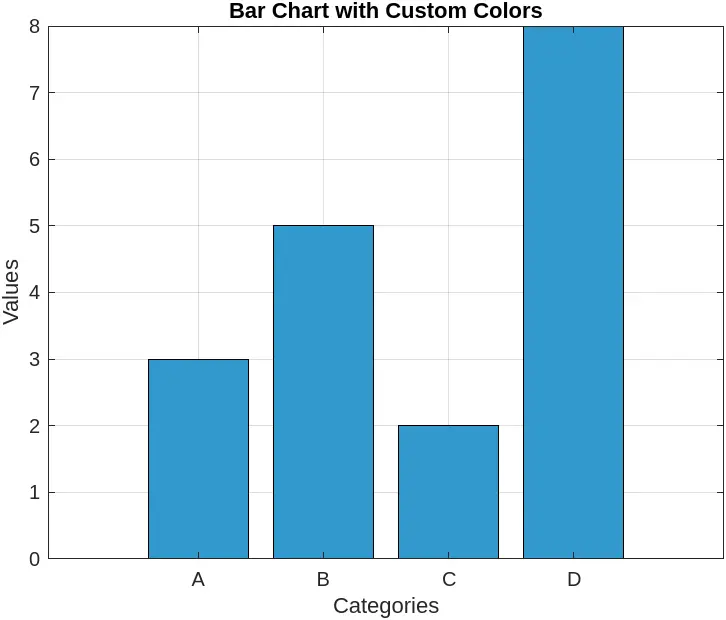
In this code, we define four categories and their corresponding values. We create a bar chart and then customize each bar’s color using an RGB triplet. The loop iterates through each bar in the chart, setting the FaceColor property to ‘flat’ and assigning the custom RGB colors from the colors matrix. This approach allows for a visually distinct representation of each category.
Customizing bar charts with RGB triplets not only enhances their aesthetic appeal but also improves the clarity of your comparisons. This method empowers you to highlight specific data points, making it easier for your audience to grasp the information at a glance.
Conclusion
Mastering RGB triplets in MATLAB can significantly elevate your data visualization game. By understanding how to apply RGB colors effectively, you can create plots that are not only informative but also visually stunning. Whether you’re working with line plots, scatter plots, or bar charts, the ability to customize colors with RGB triplets allows you to communicate your data’s story more effectively. So, the next time you visualize your data in MATLAB, don’t hesitate to experiment with RGB triplets and see how they can enhance your plots.
FAQ
-
what are RGB triplets in MATLAB?
RGB triplets are three-element vectors that represent the intensity of red, green, and blue components of a color in MATLAB. -
how do I create a custom color in MATLAB?
You can create a custom color by specifying an RGB triplet, such as [0.5, 0.5, 0] for a shade of yellow. -
can I use RGB triplets in all types of plots?
Yes, RGB triplets can be used in various types of plots, including line plots, scatter plots, and bar charts. -
how do I apply RGB triplets to scatter plots?
You can apply RGB triplets to scatter plots by assigning a matrix of colors to the ‘CData’ property of the scatter plot. -
what is the range of values for RGB triplets in MATLAB?
The values for RGB triplets range from 0 to 1, where 0 represents no intensity and 1 represents full intensity for each color component.