How to Calculate Image Histogram in MATLAB
Calculating the histogram of an image is a fundamental task in image processing, and MATLAB makes it incredibly straightforward with its built-in functions. The histogram provides valuable insights into the distribution of pixel intensities in an image, which can be crucial for various applications such as image enhancement, segmentation, and analysis.
In this article, we’ll delve into how to calculate the histogram of an image using the imhist() function in MATLAB. Whether you’re a beginner or an experienced user, this guide will help you understand the process and the significance of image histograms. Let’s get started!
Understanding Image Histograms
Before diving into the specifics of calculating histograms in MATLAB, it’s essential to understand what an image histogram represents. An image histogram is a graphical representation of the distribution of pixel values (intensities) in an image. The x-axis of the histogram represents the pixel intensity values, while the y-axis indicates the frequency of those values in the image.
A well-constructed histogram can reveal important characteristics of the image, such as its brightness, contrast, and overall tonal distribution. For example, a histogram skewed to the left indicates a darker image, while one skewed to the right suggests a brighter image. By analyzing the histogram, you can make informed decisions about how to process the image further.
Using the imhist() Function in MATLAB
The imhist() function in MATLAB is the primary tool for calculating the histogram of an image. This function is simple to use and can handle both grayscale and color images. Let’s explore how to use this function effectively.
Step 1: Load the Image
To calculate the histogram, you first need to load the image into MATLAB. You can do this using the imread() function. Here’s how you can load and display an image:
img = imread('image.jpg');
imshow(img);

In this code, imread() reads the image file named ‘image.jpg’, and imshow() displays it in a figure window. Ensure that the image file is in the current directory or provide the full path to the file.
Step 2: Calculate the Histogram
Once the image is loaded, you can calculate its histogram using imhist(). Here’s a simple example:
h = imhist(rgb2gray(img));
bar(h);
Output:
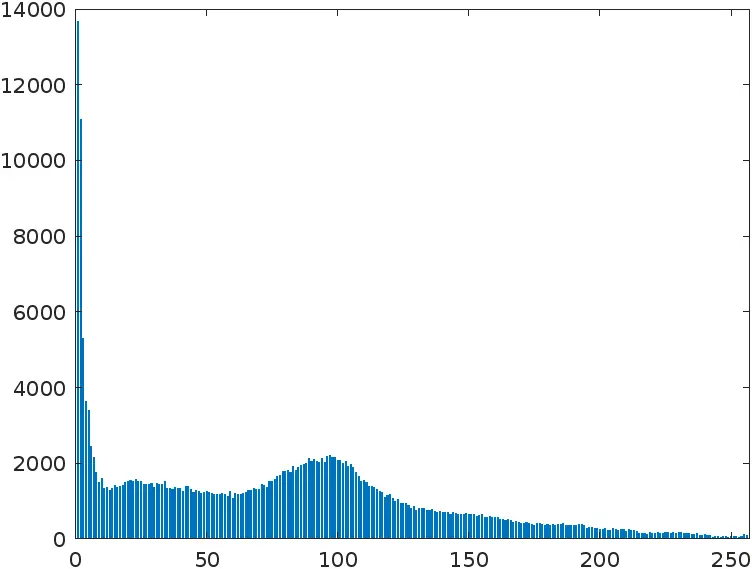
In this code snippet, rgb2gray() converts the color image to grayscale, which is necessary since imhist() works with grayscale images. The histogram data is stored in variable h, and bar() creates a bar graph to visualize the histogram.
The histogram generated will help you analyze the pixel intensity distribution of the image. A balanced histogram indicates a well-exposed image, while a histogram that is too far to one side may suggest overexposure or underexposure.
Step 3: Analyzing the Histogram
After calculating the histogram, it’s crucial to analyze it to understand the image’s characteristics better. You can identify areas where pixel intensities are concentrated, which can guide further processing steps such as contrast stretching or histogram equalization.
For example, if you notice that the histogram has a narrow range of intensity values, you might want to enhance the contrast of the image. This can be achieved using functions like imadjust() or histeq() in MATLAB.
enhanced_img = imadjust(img);
imshow(enhanced_img);
Output:
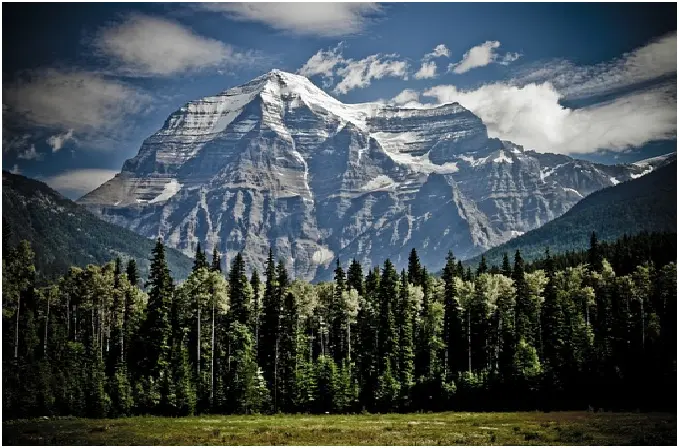
This code uses imadjust() to enhance the contrast of the original image. By visualizing the histogram before and after enhancement, you can see the difference in pixel intensity distribution.
Conclusion
Calculating the histogram of an image in MATLAB is a straightforward process that provides valuable insights into the image’s characteristics. By using the imhist() function, you can analyze pixel intensity distributions and make informed decisions about image processing techniques. Whether you’re working on image enhancement or analysis, understanding histograms is a crucial skill in the field of image processing. With the tools and techniques outlined in this article, you’re well on your way to mastering image histograms in MATLAB.
FAQ
-
How can I calculate the histogram of a color image in MATLAB?
You can calculate the histogram for each color channel separately using theimhist()function after extracting the red, green, and blue channels from the image. -
What does a histogram skewed to the left indicate?
A histogram skewed to the left suggests that the image is predominantly dark, with most pixel values concentrated in the lower intensity range. -
Can I save the histogram graph as an image file?
Yes, you can save the histogram graph using thesaveas()function in MATLAB by specifying the desired filename and format. -
What is histogram equalization?
Histogram equalization is a technique used to enhance the contrast of an image by redistributing the intensity values to cover a wider range. -
Is it possible to calculate histograms for different image formats in MATLAB?
Yes, MATLAB supports various image formats, such as JPEG, PNG, and TIFF, and you can useimread()to load them and calculate their histograms.