How to Set Figure Name in MATLAB
-
Using the
figure()Function - Setting Figure Title with Title Function
- Customizing Figure Properties
- Saving Figures with Names
- Conclusion
- FAQ

Creating visually appealing figures is an essential part of data analysis and presentation in MATLAB. Whether you’re working on a research project, preparing a presentation, or simply exploring data, naming your figures can help keep your visualizations organized and easily identifiable. In MATLAB, you can set the name and title of a figure using the figure() function, which allows you to manage multiple figures efficiently.
In this article, we will explore the different methods to set figure names in MATLAB, providing clear examples and explanations to enhance your understanding. By the end, you will be equipped with the knowledge to create well-organized and easily navigable figures in your MATLAB projects.
Using the figure() Function
One of the simplest ways to set a name for your figure in MATLAB is by using the figure() function. This function allows you to create a new figure window and specify various properties, including the figure’s name.
Here’s how you can do it:
figure('Name', 'My First Figure', 'NumberTitle', 'off');
plot(rand(1, 10), 'o-');
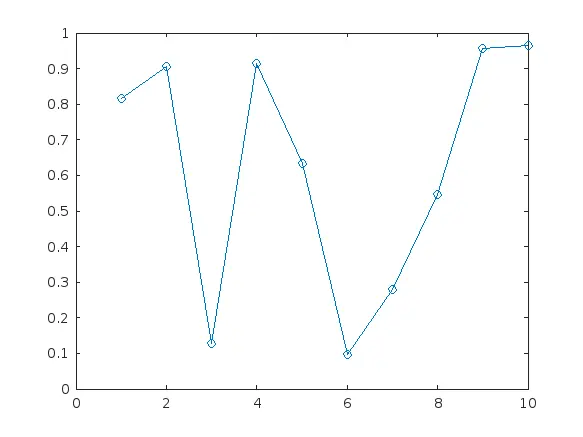
In this example, we create a new figure using the figure() function. The first argument specifies the figure’s name as “My First Figure”. The 'NumberTitle', 'off' property is used to suppress the default figure number in the title, allowing for a cleaner appearance. The plot() function then generates a simple plot of random data points. This method is straightforward and effective for setting figure names in your MATLAB projects.
Setting Figure Title with Title Function
Another way to enhance your figure’s presentation is by setting a title using the title() function. While this doesn’t change the figure’s window name, it provides a descriptive title within the figure itself.
Here’s how you can set a title:
figure;
plot(rand(1, 10), 'o-');
title('Random Data Points');
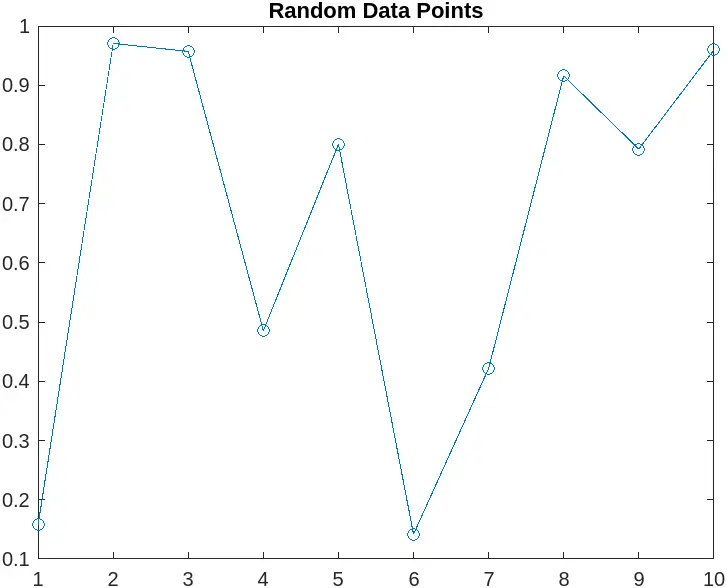
In this example, we first create a new figure window without specifying a name. We then plot random data points and use the title() function to set the title of the plot to “Random Data Points”. This method is particularly useful for providing context to the data being visualized, making it easier for viewers to understand the figure’s content.
Customizing Figure Properties
MATLAB also allows you to customize various properties of your figure, which can include setting the figure name along with other attributes like position, color, and size. This can be useful when you want to create a specific layout for your figures.
Here’s an example of how to customize a figure:
hFig = figure('Name', 'Customized Figure', 'Color', [0.8 0.8 0.8], 'Position', [100 100 600 400]);
plot(rand(1, 10), 'o-');
xlabel('X-axis Label');
ylabel('Y-axis Label');
title('Customized Random Data Plot');
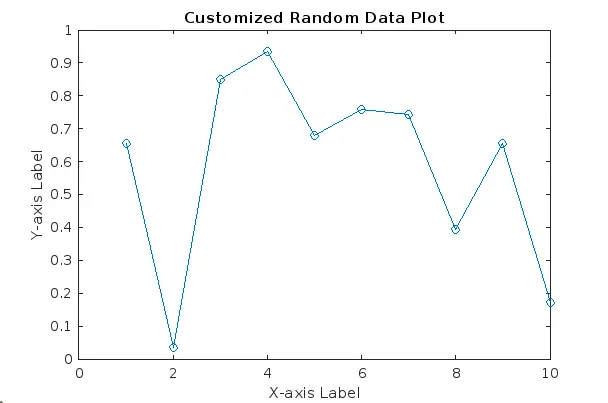
In this code, we create a figure with a customized name and background color. The Position property sets the figure’s location and size on the screen. Additionally, we use the xlabel() and ylabel() functions to label the axes, enhancing the figure’s readability. This method is ideal for creating professional-looking figures that are tailored to your specific needs.
Saving Figures with Names
Once you have created your figures, you may want to save them for later use. You can save figures with specific names using the saveas() function, which allows you to specify both the filename and the format.
Here’s how to save a figure:
figure('Name', 'My Figure to Save');
plot(rand(1, 10), 'o-');
saveas(gcf, 'My_Figure.png');
In this example, we create a figure named “My Figure to Save” and generate a plot of random data points. The saveas() function is then used to save the current figure (gcf) as a PNG file named “My_Figure.png”. This method is particularly useful for preserving your visualizations for reports, presentations, or further analysis.
Conclusion
Setting figure names in MATLAB is a straightforward process that enhances the organization and presentation of your visualizations. By utilizing the figure() function, customizing figure properties, and using the title() function, you can create well-structured figures that effectively communicate your data. Additionally, saving your figures with meaningful names ensures that you can easily locate and reference them later. Whether you’re a beginner or an experienced MATLAB user, mastering these techniques will undoubtedly improve your data visualization skills.
FAQ
-
How can I set a default figure name in MATLAB?
You can set a default figure name by creating a custom function or script that callsfigure()with your desired name and properties. -
Can I change the figure name after creating it?
Yes, you can change the figure name using theset()function, like this:set(gcf, 'Name', 'New Name'). -
What formats can I use when saving figures in MATLAB?
MATLAB supports various formats such as PNG, JPEG, PDF, and EPS. You can specify the format in thesaveas()function. -
Is it possible to create multiple figures with different names?
Absolutely! You can create multiple figures by calling thefigure()function multiple times with different names.
- How do I access a figure by its name?
You can access a figure by its name using thefindobj()function, which allows you to retrieve the figure handle based on its properties.