How to Create Animated Plot in MATLAB
- Method 1: Using the drawnow Command
-
Method 2: Combining drawnow with
pause - Method 3: Creating Multiple Animations
- Conclusion
- FAQ
Creating animated plots in MATLAB can significantly enhance your data visualization experience. Whether you’re presenting scientific data, engineering simulations, or simply showcasing mathematical functions, animated plots can make your work more engaging and insightful.
In this article, we will explore how to create animated plots using MATLAB’s drawnow command and the pause() function. These tools allow for dynamic updates to your plots, making it easier to visualize changes over time. Let’s dive into the methods you can use to animate your plots and bring your data to life!
Method 1: Using the drawnow Command
The drawnow command in MATLAB is a powerful tool for updating figures during a loop. When you call drawnow, it forces MATLAB to update the graphics immediately, displaying any changes made to the plot. This is particularly useful when you’re iterating through data points and want to visualize each step in real-time.
Here’s a simple example where we create a sine wave that animates over time:
x = 0:0.1:10;
y = sin(x);
figure;

for k = 1:length(x)
    plot(x(1:k), y(1:k), 'b-');
    axis([0 10 -1 1]);
    title('Animating a Sine Wave');
    xlabel('X-axis');
    ylabel('Y-axis');
    drawnow;
    pause(0.1);
end
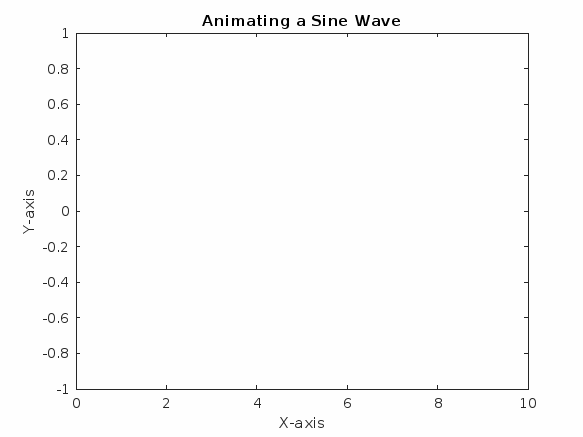
In this code, we first define the x values from 0 to 10 and calculate the corresponding y values using the sine function. The for loop iterates through each value of x, plotting the sine wave incrementally. The axis function sets the limits of the graph, while title, xlabel, and ylabel add context to the plot. The drawnow command updates the plot in real-time, and the pause(0.1) function introduces a slight delay, allowing viewers to appreciate the animation. This method is straightforward and effective for simple animations.
Method 2: Combining drawnow with pause
While the drawnow command is essential for updating plots, combining it with the pause() function allows for more control over the animation speed. By adjusting the pause duration, you can create smoother or faster animations based on your needs.
Let’s see how this works with a more complex example, animating a moving point along a circular path:
theta = linspace(0, 2*pi, 100);
x = cos(theta);
y = sin(theta);
figure;

for k = 1:length(theta)
    plot(x(k), y(k), 'ro', 'MarkerSize', 10);
    axis([-1.5 1.5 -1.5 1.5]);
    title('Moving Point on a Circle');
    xlabel('X-axis');
    ylabel('Y-axis');
    drawnow;
    pause(0.05);
end
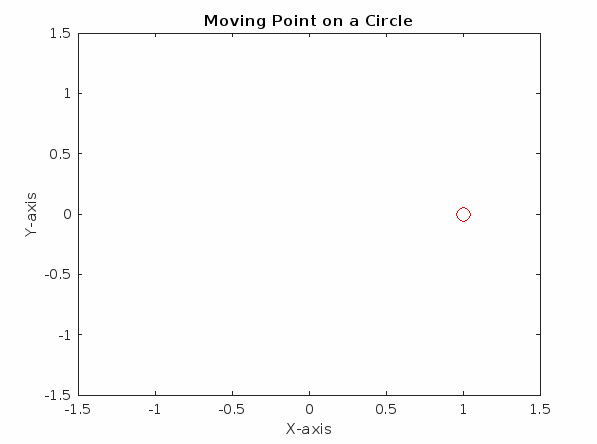
In this example, we compute the x and y coordinates of points on a circle using the cosine and sine functions. The for loop iterates through the angles defined in theta, plotting a red point at each position. The axis function ensures that the entire circle is visible, while the drawnow command updates the plot at each iteration. The pause(0.05) introduces a brief delay, making the animation smoother. Adjusting this value allows you to speed up or slow down the animation as needed.
Method 3: Creating Multiple Animations
If you want to create multiple animations in the same figure, MATLAB makes this easy to achieve. You can use multiple plot commands within the same loop, allowing for complex visualizations that can show different data sets or functions simultaneously.
For instance, let’s animate both a sine wave and a cosine wave on the same plot:
x = 0:0.1:10;
figure;

for k = 1:length(x)
    plot(x(1:k), sin(x(1:k)), 'b-', 'LineWidth', 2);
    hold on;
    plot(x(1:k), cos(x(1:k)), 'r-', 'LineWidth', 2);
    axis([0 10 -1 1]);
    title('Animating Sine and Cosine Waves');
    xlabel('X-axis');
    ylabel('Y-axis');
    legend('Sine', 'Cosine');
    drawnow;
    pause(0.1);
    hold off;
end
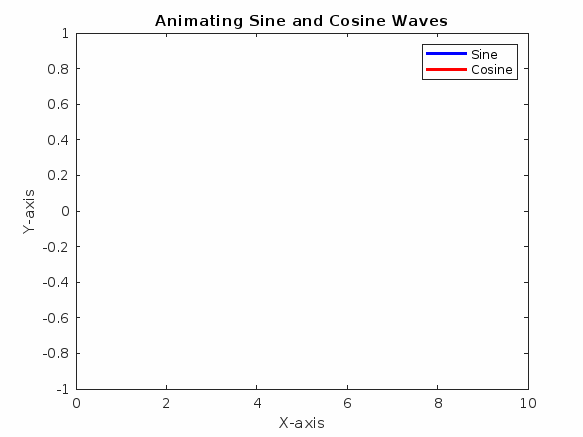
In this code, we use the hold on command to overlay multiple plots on the same figure. The loop iterates through the x values, plotting both the sine and cosine functions. The legend function helps distinguish between the two curves. By using drawnow, we ensure that both plots are updated in real-time, and pause(0.1) adds a slight delay to the animation. This method is particularly useful for comparing different datasets or functions visually.
Conclusion
Creating animated plots in MATLAB is a straightforward yet powerful way to visualize data dynamically. By utilizing the drawnow command along with the pause() function, you can bring your plots to life, making your presentations more engaging and informative. Whether you’re animating simple functions or complex datasets, these techniques will enhance your data visualization skills. So why not give it a try? Experiment with different types of data and animations to find what works best for you!
FAQ
-
How can I control the speed of the animation in MATLAB?
You can control the speed of the animation by adjusting the duration in thepause()function. A smaller value will speed up the animation, while a larger value will slow it down. -
Can I save the animated plot as a video?
Yes, you can save your animated plot as a video by using theVideoWriterfunction in MATLAB. This allows you to capture the frames of your animation and export them as a video file.
-
Is there a way to create 3D animated plots in MATLAB?
Absolutely! You can create 3D animated plots using theplot3function in MATLAB, similar to how you would useplotfor 2D plots. Just ensure you update the z-coordinates in your loop. -
What is the difference between
drawnowandpause?
Thedrawnowcommand updates the figure window, forcing MATLAB to render any changes made to the plot. Thepausefunction, on the other hand, introduces a delay in the execution of your code, allowing viewers to see the updates. -
Can I use other types of plots for animation?
Yes, you can animate various types of plots in MATLAB, including scatter plots, bar graphs, and surface plots. The principles remain the same; just update the data in your loop and usedrawnowto refresh the plot.