How to Create New Figure in Matlab
-
Understanding the
figureFunction in MATLAB - Creating Multiple Figures
- Customizing Figure Properties
- Saving Figures
- Conclusion
- FAQ

Creating visual representations of data is crucial in programming, especially when working with MATLAB. Whether you are plotting graphs, displaying images, or creating complex simulations, the ability to generate new figures is fundamental. In MATLAB, the figure() function serves as the primary tool for this purpose.
This article will guide you through the process of creating new figures in MATLAB, showcasing various methods and providing practical code examples. By the end, you will have a solid understanding of how to effectively utilize figures to enhance your data visualization capabilities in MATLAB.
Understanding the figure Function in MATLAB
The figure() function in MATLAB is versatile and straightforward. It allows you to create a new figure window, which can then be populated with plots, images, or other visual elements. To get started, simply use the figure() command.
Here’s a basic example to illustrate how to create a new figure:
figure;
plot(1:10, rand(1, 10));
title('Random Data Plot');
xlabel('X-axis');
ylabel('Y-axis');
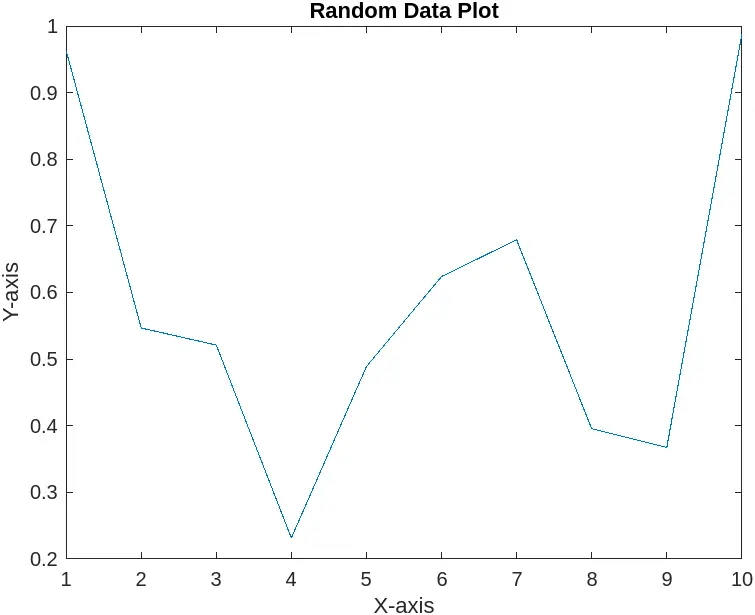
In this code, we first call figure, which opens a new figure window. We then use the plot() function to create a simple line graph of random data. The title(), xlabel(), and ylabel() functions are used to label the plot, making it easier to understand.
This basic approach is the foundation of figure creation in MATLAB. You can customize your figures further by specifying properties such as size, color, and more. This flexibility makes MATLAB a powerful tool for visual data analysis.
Creating Multiple Figures
Sometimes, you may want to create multiple figures within the same script or function. MATLAB allows you to easily manage multiple figures by using the figure(n) command, where n is a unique identifier for each figure.
Here’s how you can create multiple figures:
figure(1);
plot(1:10, rand(1, 10));
title('Figure 1: Random Data 1');

figure(2);
plot(1:10, rand(1, 10) * 2);
title('Figure 2: Random Data 2');
In this example, we create two figures. The first figure displays a plot of random data, while the second figure shows a different set of random data multiplied by 2. By assigning a unique number to each figure, you can easily switch between them and manage your visualizations effectively.
This method is particularly useful when you want to compare different datasets or visualizations side by side. You can also customize each figure independently, allowing for a high degree of flexibility in your data presentations.
Customizing Figure Properties
MATLAB provides extensive options for customizing figures. You can modify properties such as size, background color, and axes limits to enhance the visual appeal of your plots. To do this, you can specify properties directly in the figure() function or use the set() function afterward.
Here’s an example of customizing a figure:
fig = figure('Color', 'w', 'Position', [100, 100, 800, 600]);
plot(1:10, rand(1, 10), 'r-', 'LineWidth', 2);
title('Customized Figure', 'FontSize', 16);
xlabel('X-axis', 'FontSize', 14);
ylabel('Y-axis', 'FontSize', 14);
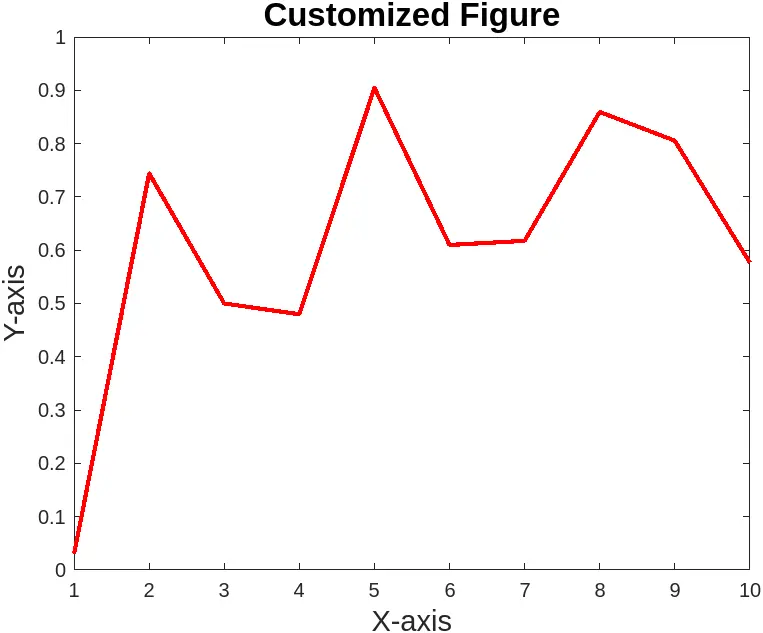
In this code, we create a new figure with a white background and a specified position and size on the screen. We then plot random data with a red line that is thicker than the default. Titles and labels are also customized with larger font sizes for better readability.
Customizing figures in MATLAB not only makes your data more visually appealing but also enhances clarity and understanding. Properly labeled and styled figures can significantly improve the communication of your data insights.
Saving Figures
Once you’ve created and customized your figures, you might want to save them for future use or for inclusion in reports. MATLAB makes it easy to save figures in various formats, including PNG, JPEG, and PDF. You can use the saveas() or exportgraphics() functions to accomplish this.
Here’s how to save a figure:
fig = figure;
plot(1:10, rand(1, 10));
title('Save This Figure');
xlabel('X-axis');
ylabel('Y-axis');

saveas(fig, 'myFigure.png');
In this example, we create a figure and plot random data. After customizing the figure with titles and labels, we use the saveas() function to save the figure as a PNG image. You can specify different file formats by changing the file extension in the saveas() function.
Saving figures is an essential step in sharing your work and presenting your findings. By keeping a record of your visualizations, you can easily reference them later or include them in presentations and publications.
Conclusion
Creating new figures in MATLAB is a fundamental skill that enhances your data visualization capabilities. With the figure() function, you can easily generate, customize, and save figures to present your data effectively. Whether you are working on simple plots or complex visualizations, understanding how to manage figures will significantly improve your MATLAB experience. By following the methods outlined in this article, you’ll be well-equipped to create engaging and informative visual representations of your data.
FAQ
-
How do I create a simple plot in MATLAB?
You can create a simple plot using theplot()function after callingfigure()to open a new figure window. -
Can I customize the size of a figure in MATLAB?
Yes, you can customize the size of a figure by using the ‘Position’ property in thefigure()function. -
How do I save a figure as a PDF in MATLAB?
Use thesaveas()function with a ‘.pdf’ extension to save your figure as a PDF file. -
What is the purpose of using multiple figures in MATLAB?
Using multiple figures allows you to compare different datasets or visualizations side by side for better analysis. -
Can I change the background color of a figure in MATLAB?
Yes, you can change the background color of a figure using the ‘Color’ property in thefigure()function.