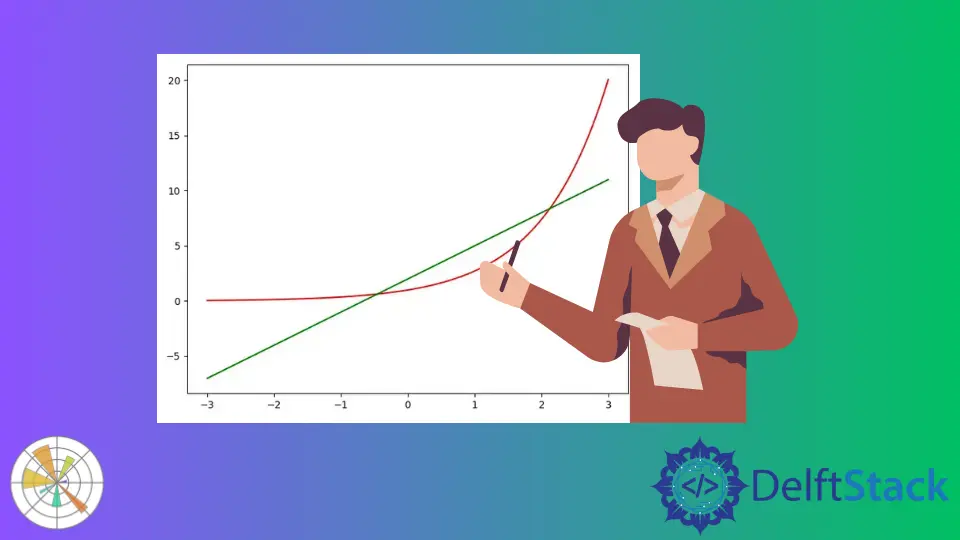
Cómo eliminar la leyenda en Matplotlib
-
matplotlib.axes.Axes.get_legend().remove() -
matplotlib.axes.Axes.get_legend().set_visible() -
Argumento
label=nolegenden el métodomatplotlib.axes.Axes.plot() -
Establezca el atributo
legend_del objeto ejes en Ninguno

Podríamos usar los métodos remove() y set_visible() del objeto de leyenda para eliminar la leyenda de una figura en Matplotlib. También podemos eliminar la leyenda de una figura en Matplotlib configurando la label en _nolegend_ en el método plot(), axes.legend en None y figure.legends en lista vacía.
matplotlib.axes.Axes.get_legend().remove()
Podemos eliminar la leyenda de la figura en Matplotlib usando el método matplotlib.axes.Axes.get_legend().remove().
import numpy as np
import matplotlib.pyplot as plt

x = np.linspace(-3, 3, 100)
y1 = np.exp(x)
y2 = 3 * x + 2

fig, ax = plt.subplots(figsize=(8, 6))

ax.plot(x, y1, c="r", label="expoential")
ax.plot(x, y2, c="g", label="Straight line")

leg = plt.legend()

ax.get_legend().remove()

plt.show()
Producción:

matplotlib.axes.Axes.get_legend().set_visible()
Si pasamos False como argumento al método matplotlib.axes.Axes.get_legend().set_visible(), podemos eliminar la leyenda de la figura en Matplotlib.
import numpy as np
import matplotlib.pyplot as plt

x = np.linspace(-3, 3, 100)
y1 = np.exp(x)
y2 = 3 * x + 2

fig, ax = plt.subplots(figsize=(8, 6))

ax.plot(x, y1, c="r", label="expoential")
ax.plot(x, y2, c="g", label="Straight line")

leg = plt.legend()

ax.get_legend().set_visible(False)

plt.show()
Producción:

Este método en realidad establece la leyenda invisible pero no elimina la leyenda.
Argumento label=nolegend en el método matplotlib.axes.Axes.plot()
Pasar label=_nolegend_ como argumento en el método matplotlib.axes.Axes.plot() también elimina la leyenda de la figura en Matplotlib.
import numpy as np
import matplotlib.pyplot as plt

x = np.linspace(-3, 3, 100)
y1 = np.exp(x)
y2 = 3 * x + 2

fig, ax = plt.subplots(figsize=(8, 6))
leg = plt.legend()

ax.plot(x, y1, c="r", label="_nolegend_")
ax.plot(x, y2, c="g", label="_nolegend_")

plt.show()
Producción:

Establezca el atributo legend_ del objeto ejes en Ninguno
Establecer el atributo legend_ del objeto axes en None elimina la leyenda de una figura en Matplotlib.
import numpy as np
import matplotlib.pyplot as plt

x = np.linspace(-3, 3, 100)
y1 = np.exp(x)
y2 = 3 * x + 2

fig, ax = plt.subplots(figsize=(8, 6))
leg = plt.legend()

ax.plot(x, y1, c="r", label="expoential")
ax.plot(x, y2, c="g", label="Straight line")

plt.gca.legend_ = None

plt.show()
Producción:

Suraj Joshi is a backend software engineer at Matrice.ai.
LinkedIn