Wie man einen einzigen Haupttitel für alle Subplots in Matplotlib festlegt
-
pyplot.suptitle(), um einen Haupttitel für alle Unterhandlungen hinzuzufügen -
figure.suptitle(), um den Haupttitel für alle Unterhandlungen hinzuzufügen

Wir verwenden die Methoden set_title(label) und title.set_text(label), um Titel zu einzelnen Subplots in Matplotlib hinzuzufügen. Um jedoch einen Haupttitel hinzuzufügen, der allen Subplots gemeinsam ist, verwenden wir die Methoden pyplot.suptitle() oder Figure.suptitle().
pyplot.suptitle(), um einen Haupttitel für alle Unterhandlungen hinzuzufügen
Wir verwenden die Methode matplotlib.pyplot.suptitle(), um den Haupttitel festzulegen, der allen Unterplots in der Matplotlib gemeinsam ist.
import numpy as np
import matplotlib.pyplot as plt

m1 = 1
c1 = 0

m2 = 2
c2 = 2

m3 = 2
c3 = 1

m4 = 1
c4 = 2

x = np.linspace(0, 3, 100)
y1 = m1 * x + c1
y2 = m2 * x + c2
y3 = m3 * x + c3
y4 = m4 * x + c4

fig, ax = plt.subplots(2, 2, figsize=(10, 8))

ax[0, 0].plot(x, y1)
ax[0, 1].plot(x, y2)
ax[1, 0].plot(x, y3)
ax[1, 1].plot(x, y4)

ax[0, 0].set_title("Line-1")
ax[0, 1].set_title("Line-2")
ax[1, 0].set_title("Line-3")
ax[1, 1].set_title("Line-4")

plt.suptitle("Various Straight Lines", fontsize=20)

fig.tight_layout()
plt.show()
Ausgabe:

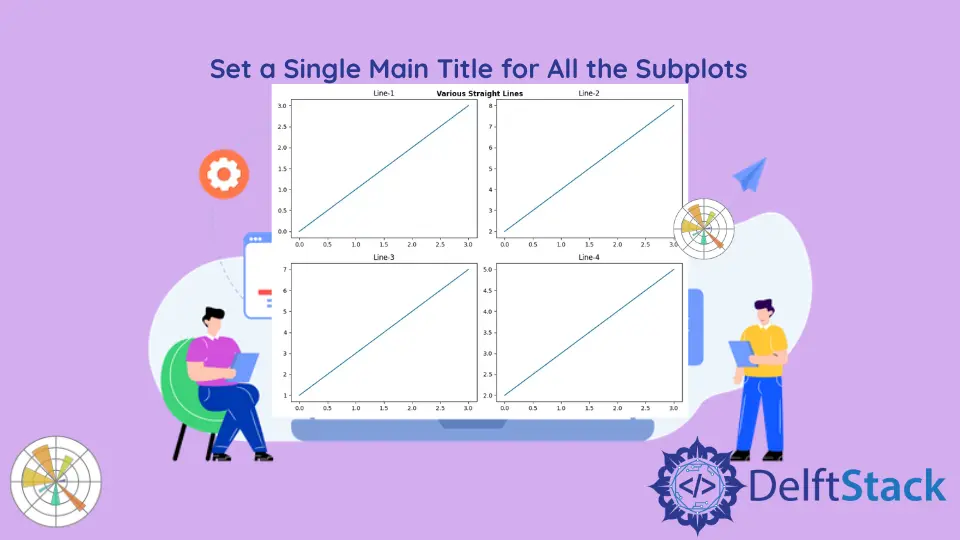
In diesem Beispiel wird die Methode axes.set_title() verwendet, um einzelnen Untergeschichten Titel hinzuzufügen, während die Methode plt.suptitle() verwendet wird, um allen Untergeschichten gemeinsame Haupttitel hinzuzufügen. Bei der plt.suptitle() Methode können wir verschiedene Parameter wie x-Koordinate, y-Koordinate, Schriftgröße und Ausrichtungen unter Verwendung verschiedener Parameter angeben. In diesem Fall wird die fontsize=20 gesetzt, um den Haupttitel von den Titeln jeder Nebenhandlung unterscheidbar zu machen.
figure.suptitle(), um den Haupttitel für alle Unterhandlungen hinzuzufügen
Die Methode matplotlib.figure.Figure.suptitle() wird auch verwendet, um den Haupttitel für alle Unterplots in einer Abbildung zu setzen.
import numpy as np
import matplotlib.pyplot as plt

m1 = 1
c1 = 0

m2 = 2
c2 = 2

m3 = 2
c3 = 1

m4 = 1
c4 = 2

x = np.linspace(0, 3, 100)
y1 = m1 * x + c1
y2 = m2 * x + c2
y3 = m3 * x + c3
y4 = m4 * x + c4

fig, ax = plt.subplots(2, 2, figsize=(10, 8))

ax[0, 0].plot(x, y1)
ax[0, 1].plot(x, y2)
ax[1, 0].plot(x, y3)
ax[1, 1].plot(x, y4)

ax[0, 0].set_title("Line-1")
ax[0, 1].set_title("Line-2")
ax[1, 0].set_title("Line-3")
ax[1, 1].set_title("Line-4")

fig.suptitle("Various Straight Lines", fontweight="bold")

fig.tight_layout()
plt.show()
Ausgabe:

Suraj Joshi is a backend software engineer at Matrice.ai.
LinkedIn