Wie man die Legende in Matplotlib entfernt
-
matplotlib.axes.Axes.get_legend().remove() -
matplotlib.axes.Axes.get_legend().set_visible() -
label=nolegendArgument inmatplotlib.axes.Axes.plot()Methode -
legend_-Attribut vonAxes-Objekt auf keine setzen
Wir könnten die Methoden remove() und set_visible() des Legendenobjekts verwenden, um die Legende von einer Abbildung in Matplotlib zu entfernen. Wir können die Legende auch aus einer Figur in Matplotlib entfernen, indem wir in der Methode plot() die Methode label auf _nolegend_, die Methode axes.legend auf None und die Methode figure.legends auf reade Liste setzen.
matplotlib.axes.Axes.get_legend().remove()
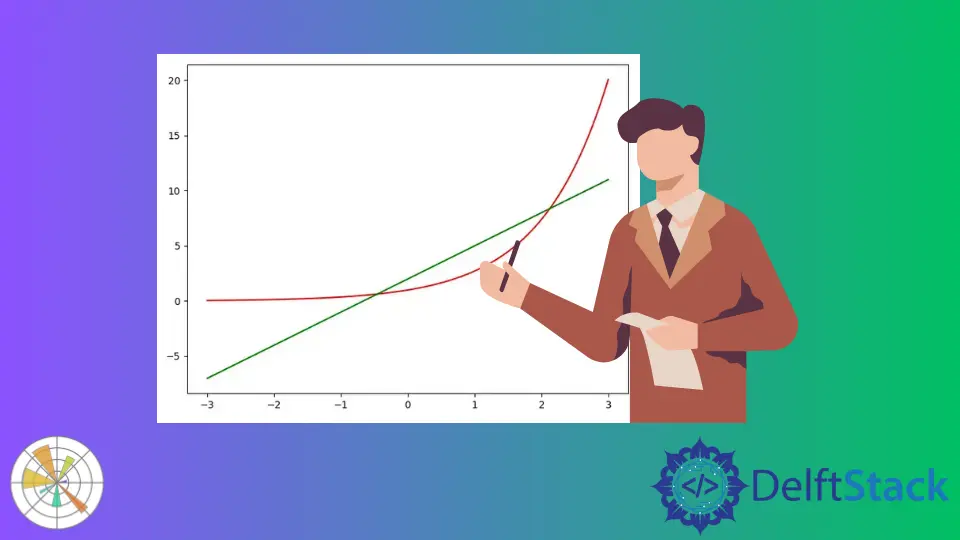
Wir können die Legende aus der Abbildung in der Matplotlib entfernen, indem wir die Methode matplotlib.axes.Axes.get_legend().get_legend().remove() verwenden.
import numpy as np
import matplotlib.pyplot as plt

x = np.linspace(-3, 3, 100)
y1 = np.exp(x)
y2 = 3 * x + 2

fig, ax = plt.subplots(figsize=(8, 6))

ax.plot(x, y1, c="r", label="expoential")
ax.plot(x, y2, c="g", label="Straight line")

leg = plt.legend()

ax.get_legend().remove()

plt.show()
Ausgabe:

matplotlib.axes.Axes.get_legend().set_visible()
Wenn wir False als Argument an die Methode matplotlib.axes.Axes.get_legend().set_visible() übergeben, können wir die Legende aus der Abbildung in der Matplotlib entfernen.
import numpy as np
import matplotlib.pyplot as plt

x = np.linspace(-3, 3, 100)
y1 = np.exp(x)
y2 = 3 * x + 2

fig, ax = plt.subplots(figsize=(8, 6))

ax.plot(x, y1, c="r", label="expoential")
ax.plot(x, y2, c="g", label="Straight line")

leg = plt.legend()

ax.get_legend().set_visible(False)

plt.show()
Ausgabe:

Diese Methode macht die Legende tatsächlich unsichtbar, löscht sie aber nicht.
label=nolegend Argument in matplotlib.axes.Axes.plot() Methode
Die Übergabe von label=_nolegend_ als Argument in der Methode matplotlib.axes.Axes.plot() entfernt auch die Legende aus der Abbildung in der Matplotlib.
import numpy as np
import matplotlib.pyplot as plt

x = np.linspace(-3, 3, 100)
y1 = np.exp(x)
y2 = 3 * x + 2

fig, ax = plt.subplots(figsize=(8, 6))
leg = plt.legend()

ax.plot(x, y1, c="r", label="_nolegend_")
ax.plot(x, y2, c="g", label="_nolegend_")

plt.show()
Ausgabe:

legend_-Attribut von Axes-Objekt auf keine setzen
Das Setzen des Attributs legend_ des Axes-Objekts auf None entfernt die Legende von einer Figur in Matplotlib.
import numpy as np
import matplotlib.pyplot as plt

x = np.linspace(-3, 3, 100)
y1 = np.exp(x)
y2 = 3 * x + 2

fig, ax = plt.subplots(figsize=(8, 6))
leg = plt.legend()

ax.plot(x, y1, c="r", label="expoential")
ax.plot(x, y2, c="g", label="Straight line")

plt.gca.legend_ = None

plt.show()
Ausgabe:


Suraj Joshi is a backend software engineer at Matrice.ai.
LinkedIn