X-Achsenwerte in Matplotlib festlegen
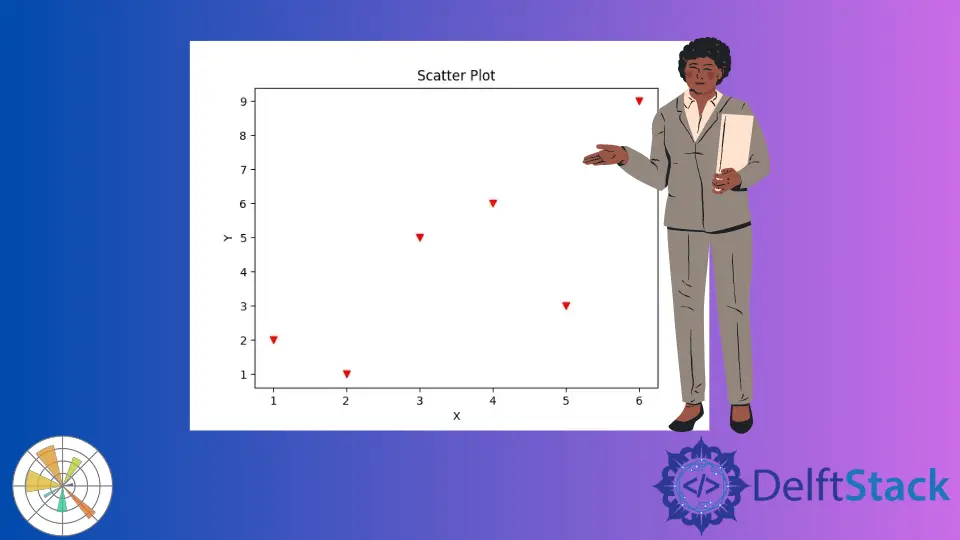
Wir können die X-Achsen-Werte mit der Methode matplotlib.pyplot.xticks() setzen. import matplotlib.pyplot as plt x = [1, 2, 3, 4, 5, 7] y = [2, 1, 6, 4, 8, 5] plt.plot(x, y, marker="o") plt.xlabel("X-Axis") plt.ylabel("Y-Axis") plt.title("Figure with default X labels") plt.show() Ausgabe: Es erzeugt eine Figur mit Standardbeschriftungen sowohl für die X- als auch für die Y-Achse. Standardmäßig werden die Ticks für die X-Achse und die Y-Achse als gleich beabstandete Werte zugewiesen, die vom Minimal- bis zum Maximalwert der jeweiligen Achse reichen.