Pandas DataFrame DataFrame.boxplot() Function
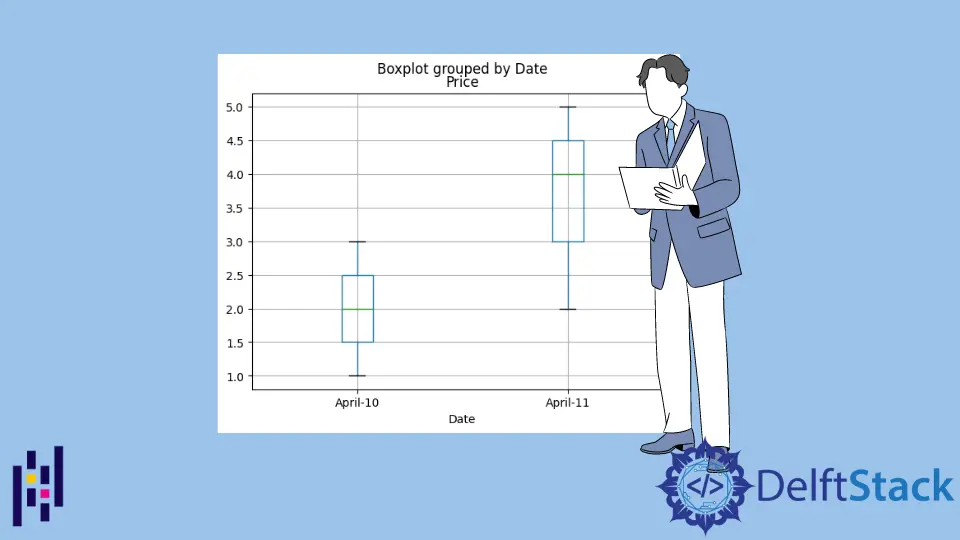
pandas.DataFrame.boxplot() makes a box-and-whisker plot from DataFrame columns. A box and whisker plot summarizes the minimum, first quartile, median, third quartile, and maximum value of data. Syntax of pandas.DataFrame.boxplot(): DataFrame.boxplot( column=None, by=None, ax=None, fontsize=None, rot=0, grid=True, figsize=None, layout=None, return_type=None, backend=None, **kwargs ) Parameters column Column name from which boxplot has to be generated by Plots different boxplots grouping by columns in different groups. ax Matplotlib axes to be used by boxplot grid Boolean.