How to Rank Pandas DataFrame Within Group

This article will discuss how to rank data in ascending and descending order. We will also learn how to rank a group of data with the help of the groupby() function in Pandas.
Use the rank() Function to Rank Pandas DataFrame in Python
The ranking is a common procedure whenever we are manipulating data or trying to figure out whether, for example, profit is high or low based on some ranking. Even sometimes, time management is interested in knowing what the top 10 products or bottom 10 products are.
In Pandas, data ranking is an operation where we want the elements of the series to be ranked or sorted according to their values. The rank operation is inspired by the SQL ROW_NUMBER, or most results we can expect from the ROW_NUMBER operation can be expected from the rank operation in Pandas.
Let’s start by writing a code to look at an example.
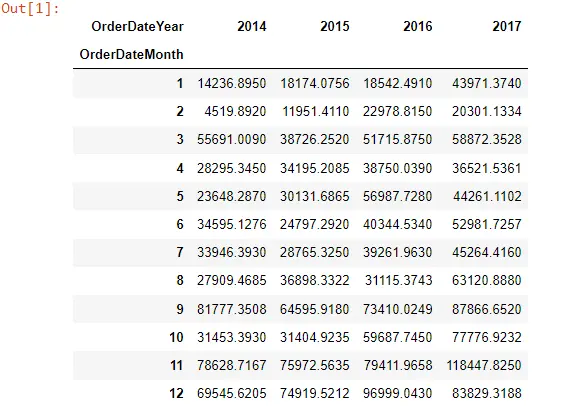
We have loaded a data set of a superstore and extracted the month and year from the data. And we have created the pivot table for the sales value over the month and year.
import numpy as np
import pandas as pd
import datetime

Store_Data = pd.read_excel("demo_Data.xls")
Store_Data["OrderDateMonth"] = Store_Data["Order Date"].apply(lambda x: x.month)
Store_Data["OrderDateYear"] = Store_Data["Order Date"].apply(lambda x: x.year)

Mon_Year_Sales = pd.pivot_table(
    Store_Data,
    index=["OrderDateMonth"],
    columns=["OrderDateYear"],
    aggfunc="sum",
    values="Sales",
)
Mon_Year_Sales
So, if we look into our pivot table, this is what it looks like:

Rank the DataFrame in Ascending and Descending Order
Now, we have to rank this data based on the values. Pandas library has a rank() function that optionally takes the parameter ascending and, by default, will arrange the data in ascending order.
The rank() function has some arguments which we can see by pressing shift+tab+tab. It will show us all arguments and definitions.

If we go ahead and apply ranking on Mon_Year_Sales and execute that, it will take all of these columns and convert them into numeric, whatever the numeric form is, and do the ranking in ascending order.
Mon_Year_Sales.rank()

The rank is calculated using the given values.
In the second row of 2014, this data is the first rank. It is arranged in ascending order because we have not passed any value to the ascending argument.
If we pass the ascending argument False, it would reorder the sequence on the descending order of the values.
Mon_Year_Sales.rank(ascending=False)
Now, the 9th month has the highest sales value in 2014, which is why it has the first rank.

Use the groupby() Method to Rank Data Based on a Group in Pandas
There are certain requirements where we want to rank data based on a group of values, not the overall. Suppose our data look like this:

Suppose we want to rank among the categories for the Profit value instead of the overall ranking.
Group_Data = (
    Store_Data.groupby(["OrderDateYear", "Category"])
    .agg({"Profit": "sum"})
    .reset_index()
)
Group_Data

For the particular year, we want to rank the profit of categories, so, for 2014, we want the second value to be the first rank because this is the maximum within 2014.
Similarly, for 2015 we want a separate ranking like starting again from 1, 2, and 3 rather than continuously going on the overall. And then, we want to know which category has the highest rank, so how can we achieve it?
To achieve the target, we will group by the year and then select the profit, then set the ascending argument to be False, meaning we want the top rank to the maximum value. Then we set the method argument to dense.
Group_Data["Rank_groupby"] = Group_Data.groupby("OrderDateYear")["Profit"].rank(
    ascending=False, method="dense"
)
Group_Data
After execution, we can now see that Office Supplies has got the first rank, and then the other group level has started again from 1, 2, and 3 for each particular year.

Full Example Code:
# In[1]:
import numpy as np
import pandas as pd
import datetime

Store_Data = pd.read_excel("demo_Data.xls")
Store_Data["OrderDateMonth"] = Store_Data["Order Date"].apply(lambda x: x.month)
Store_Data["OrderDateYear"] = Store_Data["Order Date"].apply(lambda x: x.year)

Mon_Year_Sales = pd.pivot_table(
    Store_Data,
    index=["OrderDateMonth"],
    columns=["OrderDateYear"],
    aggfunc="sum",
    values="Sales",
)
Mon_Year_Sales

# In[2]:

Mon_Year_Sales.rank()

# In[3]:

Mon_Year_Sales.rank(ascending=False)

# In[4]:

Store_Data.head(2)

# In[5]:

Group_Data = (
    Store_Data.groupby(["OrderDateYear", "Category"])
    .agg({"Profit": "sum"})
    .reset_index()
)
Group_Data

# In[6]:

Group_Data["Rank_groupby"] = Group_Data.groupby("OrderDateYear")["Profit"].rank(
    ascending=False, method="dense"
)
Group_Data
Read more related answers from here.
Hello! I am Salman Bin Mehmood(Baum), a software developer and I help organizations, address complex problems. My expertise lies within back-end, data science and machine learning. I am a lifelong learner, currently working on metaverse, and enrolled in a course building an AI application with python. I love solving problems and developing bug-free software for people. I write content related to python and hot Technologies.
LinkedIn